International migration by age and sex
Time series : Pop_5.7_Migration_DR_EN.xls
| Sex Age |
2023 | ||
|---|---|---|---|
| Immigrants in the country | Emigrants from the country | Migration increase | |
| Total | 56 807 | 15 227 | 41 580 |
| 0 - 4 | 3 013 | 264 | 2 749 |
| 5 - 9 | 2 872 | 297 | 2 575 |
| 10 - 14 | 2 152 | 385 | 1 767 |
| 15 - 19 | 3 053 | 786 | 2 267 |
| 20 - 24 | 4 140 | 1 704 | 2 436 |
| 25 - 29 | 4 297 | 1 753 | 2 544 |
| 30 - 34 | 4 387 | 1 699 | 2 688 |
| 35 - 39 | 4 937 | 1 572 | 3 365 |
| 40 - 44 | 4 382 | 1 437 | 2 945 |
| 45 - 49 | 4 066 | 1 324 | 2 742 |
| 50 - 54 | 3 862 | 991 | 2 871 |
| 55 - 59 | 3 932 | 832 | 3 100 |
| 60 - 64 | 4 446 | 709 | 3 737 |
| 65 - 69 | 3 855 | 648 | 3 207 |
| 70 - 74 | 1 973 | 433 | 1 540 |
| 75 - 79 | 870 | 236 | 634 |
| 80 + | 570 | 157 | 413 |
| Male | 30 504 | 9 267 | 21 237 |
| 0 - 4 | 1 540 | 129 | 1 411 |
| 5 - 9 | 1 477 | 158 | 1 319 |
| 10 - 14 | 1 114 | 196 | 918 |
| 15 - 19 | 1 777 | 417 | 1 360 |
| 20 - 24 | 2 428 | 1 005 | 1 423 |
| 25 - 29 | 2 506 | 1 061 | 1 445 |
| 30 - 34 | 2 353 | 1 079 | 1 274 |
| 35 - 39 | 2 606 | 1 028 | 1 578 |
| 40 - 44 | 2 443 | 948 | 1 495 |
| 45 - 49 | 2 298 | 916 | 1 382 |
| 50 - 54 | 2 186 | 665 | 1 521 |
| 55 - 59 | 2 096 | 527 | 1 569 |
| 60 - 64 | 2 200 | 423 | 1 777 |
| 65 - 69 | 1 893 | 305 | 1 588 |
| 70 - 74 | 967 | 215 | 752 |
| 75 - 79 | 401 | 121 | 280 |
| 80 + | 219 | 74 | 145 |
| Female | 26 303 | 5 960 | 20 343 |
| 0 - 4 | 1 473 | 135 | 1 338 |
| 5 - 9 | 1 395 | 139 | 1 256 |
| 10 - 14 | 1 038 | 189 | 849 |
| 15 - 19 | 1 276 | 369 | 907 |
| 20 - 24 | 1 712 | 699 | 1 013 |
| 25 - 29 | 1 791 | 692 | 1 099 |
| 30 - 34 | 2 034 | 620 | 1 414 |
| 35 - 39 | 2 331 | 544 | 1 787 |
| 40 - 44 | 1 939 | 489 | 1 450 |
| 45 - 49 | 1 768 | 408 | 1 360 |
| 50 - 54 | 1 676 | 326 | 1 350 |
| 55 - 59 | 1 836 | 305 | 1 531 |
| 60 - 64 | 2 246 | 286 | 1 960 |
| 65 - 69 | 1 962 | 343 | 1 619 |
| 70 - 74 | 1 006 | 218 | 788 |
| 75 - 79 | 469 | 115 | 354 |
| 80 + | 351 | 83 | 268 |
*Data on international migration include persons who have declared change of their present address in the country with a new one outside it or change of an address abroad with a new one in the country. |
|||
29.04.2024
Euro-SDMX Metadata Structure (ESMS)
| Contact | |
|---|---|
| Contact organisation | National Statistical Institute |
| Contact organisation unit | Population and Housing Fund Statistics Department |
| Contact name | Chrastina Petkova-Tancheva |
| Contact person function | Head of Population and Housing Fund Statistics Department |
| Contact mail address | 2, P. Volov Str.; 1038 Sofia, Bulgaria |
| Contact email address | |
| Contact phone number | +359 2 9857 553 |
| Contact fax number | |
| Metadata update | |
| Metadata last certified | 29 April 2024 |
| Metadata last posted | 29 April 2024 |
| Metadata last update | 29 April 2024 |
| Statistical presentation | |
| Data description | Persons who have changed their usual residence (current address) are surveyed. The registration is done at the moment of migration and the total migration is calculated as of 31.12 of the reference year. Internal migration is the change of usual residence within the country and international - the change of usual residence in Bulgaria with a residence abroad or vice versa. Migration growth of a given country territory is the difference between the immigration to and emigration from the area during the year. |
| Classification system | · Classification of Territorial Units for Statistical Purposes in Bulgaria (NUTS); · Unified Classification of the Administrative-Territorial and Territorial Units in Bulgaria (UCATTU); · Classification of countries (for the international migration purposes only). |
| Sector coverage | Data on migration concerns a calendar year and include all persons who have changed their current address within the country, address in the country with an address abroad and address abroad with an address in the country. |
| Statistical concepts and definitions | Migration growth of a given country territory is the difference between the immigration to and emigration from the area during the year. Net international migration is the difference between immigration into and emigration from the country. |
| Statistical unit | Migrated persons |
| Statistical population | Migrants - total number |
| Reference area | Regional breakdown of migrants is done according to the country administrative-territorial division as of 31.12 of the reference year - settlements, municipalities, districts and statistical regions. |
| Time coverage | On the NSI website · 2010 - 2023 internal migration; · 2010 - 2023 international migration. |
| Base period | Not applicable. |
| Unit of measure | |
Number; per 1000 population | |
| Reference period | |
Calendar year | |
| Institutional mandate | |
| Legal acts and other agreements | · Regulation (EU) 2020/851 of the European Parliament and of the Council amending Regulation (EC) No 862/2007 on Community statistics on migration and international protection; · Law on Statistics; · Law on Civil Registration. |
| Data sharing | Data is presented based on Regulation (EU) 2020/851 of the European Parliament and of the Council amending Regulation (EC) No 862/2007 on Community statistics on migration and international protection. |
| Confidentiality | |
| Confidentiality - policy | · Law on Statistics · Regulation (EC) No 223/2009 on European statistics (recital 24 and Article 20(4)) of 11 March 2009 (OJ L 87, p. 164), stipulates the need to establish common principles and guidelines ensuring the confidentiality of data used for the production of European statistics and the access to those confidential data with due account for technical developments and the requirements of users in a democratic society. |
| Confidentiality - data treatment | Individual data are not published in accordance with article 25 of the Law on Statistics. The publishing of individual data can be performed only in accordance with article 26 of the same law. |
| Release policy | |
| Release calendar | Information is published annually according to the Release Calendar presenting the results of the statistical surveys carried out by the National Statistical Institute. |
| Release calendar access | The calendar is available on the NSI website: https://www.nsi.bg/en/node/480 |
| User access | Data is published on the NSI website, section Population (Demography, Migration and Projections) in accordance with the Law on Statistics and the European Statistics Code of Practice respecting the professional independence and aimed at objectivity, transparency and equal treatment of all consumers. |
| Frequency of dissemination | |
Annually | |
| Accessibility and clarity | |
| News release | News release "Population and demographic processes". |
| Publications | · Population and demographic processes; · Statistical Reference book; · Statistical Yearbook. |
| On-line database | Data on migration are available to all users of the NSI website under the heading Population (Demography, Migration and Projections) - Migration: https://www.nsi.bg/en/node/6683 Information System INFOSTAT Internal migration: https://infostat.nsi.bg/infostat/pages/module.jsf?x_2=32 International migration: https://infostat.nsi.bg/infostat/pages/module.jsf?x_2=38
|
| Micro-data access | Anonymised individual data can be provide for scientific and research purposes, and for individual request according to the Rules for the provision of anonymised individual data for scientific and research purposes. |
| Other | Information service on request, according to the Rules for the dissemination of statistical products and services in NSI. |
| Documentation on methodology | · Methodology on migration: https://www.nsi.bg/sites/default/files/files/metadata/Pop_5_Metodology_migration_en.pdf; · Manual for functioning of the Unified System for Civil registration and Administrative Service of Population. |
| Quality documentation | Not available. |
| Quality management | |
| Quality assurance | Not applicable. |
| Quality assessment | Not applicable. |
| Relevance | |
| User needs | Data on migration are presented annually to the Eurostat and others - questionnaires filled in annually. At national and regional level the main data users are ministries, agencies, national organisations and local authorities. Data is presented to scientific institutes, universities, NGOs and others based on requests. |
| User satisfaction | No user' satisfaction surveys are carried out. |
| Completeness | Population data is available by sex, ages (different groupings) residence (different territorial levels), citizenship and country of birth. |
| Accuracy and reliability | |
| Overall accuracy | Not applicable. |
| Sampling error | Not applicable. |
| Non-sampling error | Not applicable. |
| Timeliness and punctuality | |
| Timeliness | Data are published up to the end of April in the year following the reference year. |
| Punctuality | Data is released according to the terms. |
| Coherence and comparability | |
| Comparability - geographical | Data is collected and processed for the different territorial units using one and the same methodology and definitions. |
| Comparability - over time | Changes of the methodology and definitions for different time periods are published in the survey methodology. |
| Coherence - cross domain | Not applicable. |
| Coherence - internal | Not applicable. |
| Cost and burden | |
Not applicable. | |
| Data revision | |
| Data revision - policy | Not applicable. |
| Data revision - practice | Not applicable. |
| Statistical processing | |
| Source data | · Source of data on migrants is the Unified System for Civil registration and Administrative Service of Population. Migration is registered through a common USCRASP-CDS document "Change of current address"; · Source of data on permanently staying foreigners is the Register of foreigners, Ministry of Interior; · Source of data on Bulgarians leaving the country - National Revenue Agency, declaration on refusal of health insurance rights due to absence from the country; National Social Security Institute |
| Frequency of data collection | · Monthly for USCRASP data; · Annually- for NRA, MI and NSSI data. |
| Data collection | Exhaustively for all migrations registered during the year. |
| Data validation | Data on demographic events is checked and controlled before to be loaded in the IS Demography. For successful processing, the initial notification should meet the system rules on validation and control. The processed results are validated in respect the consistency of a single table and between the tables. |
| Data compilation | Data is processed by the IS "Demography" according to the rules for validation and control of the demographic events. |
| Adjustment | Not applicable. |
| Comment | |
Download in SDMX 2.1 file format: INTERNAL AND INTERNATIONAL MIGRATION - Immigrants, Emigrants, Migration increase, Internal migration and International migration
Metadata Structure Definition in SDMX 2.1: ESMS_MSD+BNSI+2.0+SDMX.2.1.xml
Download in SDMX 2.0 file format: INTERNAL AND INTERNATIONAL MIGRATION - Immigrants, Emigrants, Migration increase, Internal migration and International migration
Metadata Structure Definition in SDMX 2.0: ESMS_MSD+BNSI+2.0+SDMX.2.0.xml
ESS Standard for Quality Reports Structure (ESQRS)
| Contact | |
|---|---|
| Contact organisation | National Statistical Institute |
| Contact organisation unit | Population and Housing Fund Statistics Department |
| Contact name | Chrastina Petkova-Tancheva |
| Contact person function | Head of Population and Housing Fund Statistics Department |
| Contact mail address | 2, P. Volov Str.; 1038 Sofia, Bulgaria |
| Contact email address | |
| Contact phone number | +359 2 9857 553 |
| Contact fax number | |
| Statistical presentation | |
| Data description | Persons who have changed their usual residence (current address) are surveyed. The registration is done at the moment of migration and the total migration is calculated as of 31.12 of the reference year. Internal migration is the change of usual residence within the country and international - the change of usual residence in Bulgaria with a residence abroad or vice versa. Migration growth of a given country territory is the difference between the immigration to and emigration from the area during the year. |
| Classification system | · Classification of Territorial Units for Statistical Purposes in Bulgaria (NUTS); · Unified Classification of the Administrative-Territorial and Territorial Units in Bulgaria (UCATTU); · Classification of countries (for the international migration purposes only). |
| Sector coverage | Data on migration concerns a calendar year and include all persons who have changed their current address within the country, address in the country with an address abroad and address abroad with an address in the country. |
| Statistical concepts and definitions | Migration growth of a given country territory is the difference between the immigration to and emigration from the area during the year. Net international migration is the difference between immigration into and emigration from the country. |
| Statistical unit | Migrated persons |
| Statistical population | Migrants - total number |
| Reference area | Regional breakdown of migrants is done according to the country administrative-territorial division as of 31.12 of the reference year - settlements, municipalities, districts and statistical regions. |
| Time coverage | On the NSI website · 2010 - 2023 internal migration; · 2010 - 2023 international migration. |
| Base period | Not applicable. |
| Statistical processing | |
| Source data | · Source of data on migrants is the Unified System for Civil registration and Administrative Service of Population. Migration is registered through a common USCRASP-CDS document "Change of current address"; · Source of data on permanently staying foreigners is the Register of foreigners, Ministry of Interior; · Source of data on Bulgarians leaving the country - National Revenue Agency, declaration on refusal of health insurance rights due to absence from the country; National Social Security Institute |
| Frequency of data collection | · Monthly for USCRASP data; · Annually- for NRA, MI and NSSI data. |
| Data collection | Exhaustively for all migrations registered during the year. |
| Data validation | Data on demographic events is checked and controlled before to be loaded in the IS Demography. For successful processing, the initial notification should meet the system rules on validation and control. The processed results are validated in respect the consistency of a single table and between the tables. |
| Data compilation | Data is processed by the IS "Demography" according to the rules for validation and control of the demographic events. |
| Adjustment | Not applicable. |
| Quality management | |
| Quality assurance | Not applicable. |
| Quality assessment | Not applicable. |
| Relevance | |
| User needs | Data on migration are presented annually to the Eurostat and others - questionnaires filled in annually. At national and regional level the main data users are ministries, agencies, national organisations and local authorities. Data is presented to scientific institutes, universities, NGOs and others based on requests. |
| User satisfaction | No user' satisfaction surveys are carried out. |
| Completeness | Population data is available by sex, ages (different groupings) residence (different territorial levels), citizenship and country of birth. |
| Data completeness - rate | 100% |
| Accuracy and reliability | |
| Overall accuracy | Not applicable. |
| Sampling error | Not applicable. |
| Sampling errors - indicators | Not applicable |
| Non-sampling error | Not applicable. |
| Coverage error | Not applicable |
| Over-coverage - rate | Not applicable |
| Common units - proportion | Not applicable |
| Measurement error | Not applicable |
| Non response error | Not applicable |
| Unit non-response - rate | not applicable |
| Item non-response - rate | Not applicable |
| Processing error | Not applicable |
| Imputation - rate | Not applicable |
| Model assumption error | Not applicable |
| Seasonal adjustment | Not applicable |
| Data revision - policy | Not applicable. |
| Data revision - practice | Not applicable. |
| Data revision - average size | Not applicable |
| Timeliness and punctuality | |
| Timeliness | Data are published up to the end of April in the year following the reference year. |
| Time lag - first results | 4 months after the reference year |
| Time lag - final results | 4 months after the reference year |
| Punctuality | Data is released according to the terms. |
| Punctuality - delivery and publication | Data is released and published according to the terms |
| Coherence and comparability | |
| Comparability - geographical | Data is collected and processed for the different territorial units using one and the same methodology and definitions. |
| Asymmetry for mirror flows statistics - coefficient | Not applicable |
| Comparability - over time | Changes of the methodology and definitions for different time periods are published in the survey methodology. |
| Length of comparable time series | 2007 onwards |
| Coherence - cross domain | Not applicable. |
| Coherence - sub annual and annual statistics | Not applicable |
| Coherence - National Accounts | Not applicable |
| Coherence - internal | Not applicable. |
| Accessibility and clarity | |
| News release | News release "Population and demographic processes". |
| Publications | · Population and demographic processes; · Statistical Reference book; · Statistical Yearbook. |
| On-line database | Data on migration are available to all users of the NSI website under the heading Population (Demography, Migration and Projections) - Migration: https://www.nsi.bg/en/node/6683 Information System INFOSTAT Internal migration: https://infostat.nsi.bg/infostat/pages/module.jsf?x_2=32 International migration: https://infostat.nsi.bg/infostat/pages/module.jsf?x_2=38
|
| Data tables - consultations | |
| Micro-data access | Anonymised individual data can be provide for scientific and research purposes, and for individual request according to the Rules for the provision of anonymised individual data for scientific and research purposes. |
| Other | Information service on request, according to the Rules for the dissemination of statistical products and services in NSI. |
| Metadata - consultations | |
| Documentation on methodology | · Methodology on migration: https://www.nsi.bg/sites/default/files/files/metadata/Pop_5_Metodology_migration_en.pdf; · Manual for functioning of the Unified System for Civil registration and Administrative Service of Population. |
| Metadata completeness – rate | |
| Quality documentation | Not available. |
| Cost and burden | |
Not applicable. | |
| Confidentiality | |
| Confidentiality - policy | · Law on Statistics · Regulation (EC) No 223/2009 on European statistics (recital 24 and Article 20(4)) of 11 March 2009 (OJ L 87, p. 164), stipulates the need to establish common principles and guidelines ensuring the confidentiality of data used for the production of European statistics and the access to those confidential data with due account for technical developments and the requirements of users in a democratic society. |
| Confidentiality – data treatment | Individual data are not published in accordance with article 25 of the Law on Statistics. The publishing of individual data can be performed only in accordance with article 26 of the same law. |
| Comment | |
Download in SDMX 2.1 file format: INTERNAL AND INTERNATIONAL MIGRATION - Immigrants, Emigrants, Migration increase, Internal migration and International migration
Metadata Structure Definition in SDMX 2.1: ESQRS_MSD+BNSI+2.0+SDMX.2.1.xml
Download in SDMX 2.0 file format: INTERNAL AND INTERNATIONAL MIGRATION - Immigrants, Emigrants, Migration increase, Internal migration and International migration
Metadata Structure Definition in SDMX 2.0: ESQRS_MSD+BNSI+2.0+SDMX.2.0.xml
Population and Demographic Processes in 2023
As of December 31, 2023, the population of Bulgaria is 6 445 481 persons. Compared to 2022, the country’s population decreased by 2 229 persons or by 0.03%.
There are 57 478 children born in 2023, of which 57 197 (99.5%) - live born. The number of live births increased by 601 children, or 1.1% compared to the previous year.
The number of deaths in 2023 is 101 006 and compared to the previous year, decreased by 17 808, or by 15.0%.
...Households in the Republic of Bulgaria as of September 7, 2021
As of September 7, 2021 there are 2 866 657 households in Bulgaria - private and institutional. Nearly three-quarters (74.9 %) of all households live in cities. The average size of a household decreased from 5.6 persons in 1900 to 2.2 persons in 2021. As of September 7, 2021, 949 institutional households were counted in Bulgaria, in which 25 866 people live, or 0.4% of the country's population. Their average size is 27.3 persons.
...Life Expectancy at Birth in the Period 2020 - 2022
Life expectancy at birth of the Bulgarian population, calculated for the period 2020 - 2022, is 71.9 years.
Life expectancy at birth for the male population is 68.3 years, while for females it is 7.5 years higher - 75.8 years.
...Population and Demographic Processes in 2022
According to the Demography statistics, the population of the country as of the end of 2022 is 6 447 710 persons. Compared to the previous year, it has decreased by 34 774 persons, or by 0.5%.
There are 56 596 live born children in 2022. The number of live births decreases by 2 082 compared to the previous year.
The number of deaths in 2022 is 118 814, and the crude mortality rate - 18.4‰. Compared to the previous year, the number of deaths decreases by 30 181.
...Migration and migration behaviour (Sample survey accompanying Census 2021)
In 2021, 2.4% of persons aged 15 - 74 have already decided to change their current place of residence in the country, and 2.9% intend to move, but do not have a final decision yet. Migrants with weak expressed willingness are 8.5%. 86.2% of persons in the respective age group are not willing to migrate.
The share of potential migrants within the country is highest among the young 15 - 19 years (7.1%) and 20 - 29 years (6.1%).
In 2021, 11.9% of persons aged 15 - 74 are very or somewhat likely to move to live abroad. Compared to 2011, the ...
Fertility and reproductive behavior (Sample survey accompanying Census 2021)
In 2021 also, the two-child family model is the reproductive ideal of women aged 15 - 49 and men aged 15 - 59 in our country (63.3%). In second place in the distribution is the opinion that the family should have three children (17.1%), followed by the family with one child (7.9%). In 2021, 9.4% of persons of reproductive age cannot estimate how many children a family should have in Bulgaria. The multi-child model of a family with four or more children is a priority for 2.0% of people.
To some extent, people's attitudes echo their ideal of family. Leading is the desire for two chi...
Health status of the population as of September 7, 2021
The United Nations Convention on the Rights of Persons with Disabilities defines that ‘persons with disabilities include persons with permanent physical, mental, intellectual and sensory impairments which, in interaction with their environment, could hinder their full and effective participation in society on an equal basis with others’. This definition requires the availability of statistical data not only on the number and different socio-demographic characteristics of people with disabilities in accordance with national legislation, but also a wider set of data. Therefore, during the cen...
Deaths in the Fourth Quarter of 2022 (preliminary data)
The number of deaths in the fourth quarter of 2022 (40th - 52nd week) is 26 078 and the crude mortality rate - 15.3‰. Mortality among males (16.4‰) is higher than among females (14.3‰). Compared to the same period of the previous year, the number of deaths has decreased by 20 305, or 43.8%.
...Birth rate
The birth rate is one of the main factors influencing the number and structures of the population. Since the beginning of the 1950s, a permanent trend of decreasing birth rates has been observed in the country. The reasons for this are many and different during the different periods of the demographic development of Bulgaria. The change in the family model, the changing socio-economic environment, the general reduction of the population, in particular of the fertile contingents, the postponement of marriage and the birth of the first child and, last but not least, the emigration from the co...
Location of the workplace/educational institution of employed and students as of September 7, 2021
The phenomenon of daily labour migration closely relates to the economic condition of settlements, their location and infrastructure, as well as the presence and characteristics of the labour force in them. The importance of this process for society is great, since participation in daily trips, unlike permanent resettlement, does not lead to depopulation of settlements or to disruption of the age structure of the population.
Employed
As of September 7, 2021, 121 235 individuals, or 5.1% of those who answered the question, indicated that they mostly work ...
Migration
Population migration is a major factor that affects the number and structures of the population both for the country as a whole and for individual regions and territories.
As of September 7, 2021, 395 690 persons declared that they had changed the place of their habitual residence within the country during the period 2011 - 2021. Migrant women are 213 558, or 54.0%, and men - 182 132, or 46.0% of the migrated persons.
As of September 7, 2021, 354 138 persons declared that they resided outside the country for more than one year during the period 1980 - 2021 and returned o...
Ethno-cultural characteristics of the population as of september 7, 2021
As of September 7, 2021, the Bulgarian ethnic group comprised 5 118 494, or 84.6% of the persons who answered the question about ethnicity. Compared to 2011, the share of this group decreased by 0.2 percentage points. 508 378, or 8.4% of the respondents, identified themselves as belonging to the Turkish ethnic group. Their relative share decreased by 0.4 percentage points compared to 2011. 266 720, or 4.4% of the respondents, identified themselves as the third-largest Roma ethnic group. The relative share of the population from this et...
Main results of the post enumeration censuses as of September 7, 2021
During the period October 11, 2021 - October 31, 2021, the National Statistical Institute conducted two post-enumeration sample surveys to check the accuracy of the registered data and the completeness of the coverage of the units of observation.
The results of the post-enumeration surveys confirm the conclusions already made about the not enumerated persons between 573.9 and 631.0 thousand. Not enumerated males predominate (9.9%) over the not enumerated females (8.7%).
The results are good, as regards the accuracy of the registered data, for the information gathered abo...
Socio-economic characteristics of the population as of September 7, 2021
As of September 7, 2021, there were 2 953 937 economically active persons aged 15 and over, or 45.3% of the country's population. 2 661 292 of them were employed, while 292 645 were unemployed. Compared to 2011, the number of economically active persons decreased by 376 thousand, or by 11.3%.
The educational structure of the population aged 7 and over is improving, with 1 560.0 thousand tertiary graduates by September 7, 2021, or one in four (25.5%) being a tertiary graduate. The number of persons with primary education and no education is 666.7 thousand, with their...
Deaths in the Third Quarter of 2022 (preliminary data)
The number of deaths in the third quarter of 2022 (27th - 39th week) is 24 711 and the crude mortality rate is 14.5‰. Mortality among males (15.6‰) is higher than among females (13.5‰). Compared to the same period of the previous year, the number of deaths has decreased by 6 092, or 19.8%.
...Population as of September 7, 2021
The population of the country as of September 7, 2021, is 6 519 789. Women are 3 383 527 (51.9%), and men are 3 136 262 (48.1%), or there are 927 men per 1 000 women. 4 782 064 people live in the towns, or 73.3%, and 1 737 725 people live in the villages, or 26.7% of the population of the country.
...Deaths in the Second Quarter of 2022 (preliminary data)
The number of deaths in the second quarter of 2022 (14th - 26th week) is 24 910 and the crude mortality rate is 14.6‰. Mortality among males (15.8‰) is higher than among females (13.6‰). Compared to the same period of the previous year, the number of deaths has decreased by 9 702, or 28.0%.
...Life Expectancy at Birth in the Period 2019 - 2021
Life expectancy at birth of the Bulgarian population, calculated for the period 2019 - 2021, is 73.6 years.
Life expectancy at birth for the male population is 70.1 years, while for females it is 7.3 years higher - 77.4 years.
...Population and Demographic Processes in 2021
According to Demography statistics data population of the country as of the end of the 2021 the population is 6 838 937 persons. Compared to the previous year it has decreased by 77 611 persons or by 1.1%.
There are 58 678 live born children in 2021. The number of live births decreases by 408 compared to the previous year.
The number of deaths in 2021 is 148 995 and the crude mortality rate - 21.7‰. Compared to the previous year the number of deaths increases by 24 260.
...Deaths in the First Quarter of 2022 (preliminary data)
The number of deaths in the first quarter of 2022 (1st - 13th week) is 38 434 and the crude mortality rate - 22.6‰. Mortality among males (24.5‰) is higher than among females (20.8‰). Compared to the same period of the previous year, the number of deaths has increased by 1 590, or 4.3%.
...Deaths in the Fourth Quarter of 2021 (preliminary data)
The number of deaths in the fourth quarter of 2021 (40th - 52nd week) is 45 812 and the crude mortality rate - 26.7‰. Mortality among males (28.2‰) is higher than among females (25.4‰). Compared to the same period of the previous year, the number of deaths has increased by 1 841 or 4.2%. Compared to the third quarter of 2021 mortality increased by 15 099 or by 49.2%.
...Deaths in the Third Quarter of 2021 (preliminary data)
The number of deaths in the third quarter of 2021 (27th - 39th week) is 30 071 and the crude mortality rate - 17.5‰. Compared to the same period in the previous year, the number of deaths has increased by 4 463 or 17.4%. According to second quarter of 2021 mortality decreased by 4 276 or by 12.4%. Mortality among males (18.7‰) is higher than among females (16.5‰).
...Deaths in the Second Quarter of 2021 (preliminary data)
The number of deaths in the second quarter of 2021 (14th - 26th week) is 33 945 and the crude mortality rate - 19.8‰. Compared to the same period in the previous year, the number of deaths has increased by 8 754 or 33.8%. According to first quarter of 2021 mortality decreased by 2 601 or by 7.1%. Mortality among males (21.4‰) is higher than among females (18.3‰).
...Deaths in the First Quarter of 2021 (preliminary data)
The number of deaths in the first quarter of 2021 (1st – 13th week) is 36 152 and the crude mortality rate - 21.1‰. Compared to the same period in the previous year, the number of deaths has increased by 7 491 or 26.1%. Mortality among males (22.9‰) is higher than among females (19.3‰).
...Life Expectancy at Birth in the Period 2018 - 2020
Life expectancy at birth of the Bulgarian population calculated for the period 2018 - 2020 is 74.6 years.
Life expectancy at birth for male population is 71.1 years, while for female it is 7.1 years higher - 78.2 years.
...Population and Demographic Processes in 2020
As of 31 December 2020 the population of Bulgaria is 6 916 548 persons. Compared to 2019, the population decreases by 34 934 persons.
There are 59 086 live born children in 2020. The number of live births decreases by 2 452 compared to the previous year.
The number of deaths in 2020 is 124 735 and the crude mortality rate - 18.0‰. Compared to the previous year the number of deaths icreases by 16 652.
...Life Expectancy at Birth in the Period 2017 - 2019
Life expectancy at birth of the Bulgarian population calculated for the period 2017 - 2019 is 74.9 years.
Life expectancy at birth for male population is 71.5 years, while for female it is 7.0 years higher - 78.5 years.
...Population and Demographic Processes in 2019
As of 31 December 2019 the population of Bulgaria is 6 951 482 persons, representing 1.4% of the EU population. Compared to 2018, the population decreases by 48 557 persons.
There are 61 538 live born children in 2019. The number of live births decreases by 659 compared to the previous year.
The number of deaths in 2019 is 108 083 and the crude mortality rate - 15.5‰. Compared to the previous year the number of deaths decreases by 443.
...Life Expectancy at Birth in the Period 2016 - 2018
Life expectancy at birth of the Bulgarian population calculated for the period 2016 - 2018 is 74.8 years.
Life expectancy at birth for male population is 71.4 years, while for female it is 7.0 years higher - 78.4 years.
...Population and Demographic Processes in 2018
As of 31 December 2018 the population of Bulgaria is 7 000 039 persons, representing 1.4% of the EU population. Compared to 2017, the population decreases by 49 995 persons.
There are 62 197 live born children in 2018. The number of live births decreases by 1 758 compared to the previous year.
The number of deaths in 2018 is 108 526 and the crude mortality rate - 15.4‰. Compared to the previous year the number of deaths decreases by 1 265.
...Names in Bulgaria in 2018 (preliminary data)
What names did we give our children in 2018?
Which are the most popular surnames and the most common male and female names in Bulgaria?
Does Alexander retain in 2018 the top position in the names of newborn boys?
These are just some of the questions we answer with the new infographic ‘Names in Bulgaria 2018’.
...Life Expectancy at Birth in the Period 2015 - 2017
Life expectancy at birth of the Bulgarian population calculated for the period 2015 - 2017 is 74.8 years.
Life expectancy at birth for male population is 71.3 years, while for female it is 7.1 years higher - 78.4 years.
...Population and Demographic Processes in 2017
As of 31 December 2017 the population of Bulgaria is 7 050 034 persons, representing 1.4% of the EU population. Compared to 2016, the population decreases by 51 825 persons.
There are 63 955 live born children in 2017. The number of live births decreases by 1 029 compared to the previous year.
The number of deaths in 2017 is 109 791 and the crude mortality rate - 15.5‰. Compared to the previous year the number of deaths increases by 2 211.
...Names in Bulgaria in 2017 (preliminary data)
The most preferred names for new-born boys in 2017 are Aleksandar, Georgi and Martin, and for new-born girls - Viktoria, Maria and Nikol.
The largest number of Bulgarians celebrate a name day on Tsvetnitsa (Palm Day), Ivanovden (The day of St. Ioan) and Arhangelovden (Michaelmas day).
The leading names by regions for men are Georgi, Ivan and Dimitar, and for women - Maria, Ivanka and Elena.
...Life Expectancy at Birth in the Period 2014 - 2016
Life expectancy at birth of the Bulgarian population calculated for the period 2014 - 2016 is 74.7 years.
Life expectancy at birth for male population is 71.2 years, while for female it is 7.0 years higher - 78.2 years.
...Population and Demographic Processes in 2016
As of 31 December 2016 the population of Bulgaria is 7 101 859 persons or 1.4% of the EU population. Compared to 2015, the population of the country decreases by 51 925 persons.
There are 64 984 live born children in 2016. The number of live births decreases by 966 children compared to the previous year.
The number of dead persons is 107 580 and the crude mortality rate - 15.1‰. Compared to the previous year the number of dead people decreases by 2 537.
...Names in Bulgaria in 2016 (preliminary data)
Aleksandar and Viktoria are the most preferred names for new-born babies in Bulgaria in 2016.
...Life Expectancy at Birth in the Period 2013 - 2015
Life expectancy at birth of the Bulgarian population calculated for the period 2013 - 2015 is 74.5 years
Life expectancy at birth for male population is 71.1 years, while for female it is 6.9 years higher - 78.0 years.
...Population and Demographic Processes in 2015
As of 31 December 2015 the population of Bulgaria is 7 153 784 persons, representing 1.4% of the EU population. Compared to 2014, the population decreases by 48 414 persons.
There are 65 950 live born children in 2015. The number of live births decreases by 1 635 compared to the previous year.
The number of deaths in 2015 is 110 117 and the crude mortality rate - 15.3‰. Compared to the previous year the number of deaths increases by 1 165.
...Life Expectancy at Birth in the Period 2012 - 2014
Life expectancy at birth of the Bulgarian population calculated for the period 2012 - 2014 is 74.7 years. Compared to the previous period (2011 - 2013) it increased by 0.2 years.
Life expectancy at birth for male population is 71.2 years, while for female it is 7.1 years higher - 78.3 years.
...Population and Demographic Processes in 2014 (Final data)
As of 31 December 2014 the population of Bulgaria is 7 202 198 persons or 1.4% of the EU population. Compared to 2013, the population of the country decreases by 43 479 persons.
There are 67 585 live born children in 2014. The number of live births increases by 1 007 children compared to the previous year.
The number of dead persons is 108 952 and the crude mortality rate - 15.1‰. Compared to the previous year the number of dead people increases by 4 607.
...Life Expectancy at Birth in the Period 2011 – 2013
Life expectancy at birth of Bulgarian population calculated for the period 2011 - 2013 is 74.5 years. Compared to the previous period (2010 – 2012) it has increased by 0.5 years.
Life expectancy at birth for male population is 71.0 years, while for female - it is 7 years higher - 78.0 years.
...Demographic Processes in 2013 (Final data)
As of 31 December 2013 the population of Bulgaria is 7 245 677 persons or 1.4% of the EU population. Compared to 2012, the population of the country decreases by 38 875 persons.
There are 66 578 live born children in 2013. The number of live births decreases by 2 543 children compared to the previous year.
The number of dead persons is 104 345 and the crude mortality rate - 14.4‰. Compared to the previous year the number of dead people decreases by 4 936.
...Demographic Processes in 2012
As of 31 December 2012 the population of Bulgaria is 7 282 041 persons or 1.5% of the EU population. Compared to 2011, the country population decreases by 45 183 persons.
There are 69 121 live born children in 2012. The number of live births decreases by 1 725 children compared to the previous year.
The number of dead persons is 109 281 and the crude mortality rate - 15.0‰. Compared to the previous year the number of dead people increases by 1 023....
Demographic Processes in 2011
2009-2010 Time Use Survey (Basic results)
Demographic Processes in 2010
Express Results from Bulgarian Population and Housing Census 2011
Regions, districts and municipalities in the Republic of Bulgaria 2022
The National Statistical Institute offers to the users the specialized electronic publication Regions, districts and municipalities in the Republic of Bulgaria 2022.
The publication contains data about the demographic and socio-economic conditions and environment of Bulgaria’s regions, districts and municipalities in 2022. Some of the most important indicators have been chosen in order to reveal the specifics of the local administrative units and the territorial units for statistics in Bulgaria (NUTS).
The pu...
Health Services 2023
The National Statistical Institute presents to users of statistical information in the field of the social statistics the annual electronic publication Health Services 2023 (in Bulgarian), a joint edition of the National Statistical Institute and the National Center of Public Health and Analyses at the Ministry of Health.
The data sources are the statistical surveys carried out by the both institutions.
In the publication data are systematized as follows:
• Population and demographic process - main demographic indicators - population number and structures, fert...
Population and Demographic Processes 2022
The NSI’s annual electronic publication, Population and Demographic Processes 2022, is available for users of statistical information.
The issue is bilingual (Bulgarian and English) and contains detailed statistical information about the demographic state of the Republic of Bulgaria during the year 2022. Data for the number and structure of the population and for its natural movement and internal migration are published in the issue.
The information about the vital statistics contains data for marriages, births, deaths, divorces and migration r...
Statistical Reference Book 2023 (Bulgarian version)
The National Statistical Institute presents to users of statistical information the annual publication - Statistical Reference Book 2023 in Bulgarian.
The Statistical Reference Book presents topical information on the demographic processes as well as the economic, social and cultural development of the Republic of Bulgaria for the 2018 - 2022 period.
The publication presents data on main macroeconomic indicators of the national economy - gross domestic product, investments and finance; and economic activity groupings ...
Statistical Reference Book 2023
The National Statistical Institute presents to users of statistical information the annual publication - Statistical Reference Book 2023 in English.
The Statistical Reference Book presents topical information on the demographic processes as well as the economic, social and cultural development of the Republic of Bulgaria for the 2018 - 2022 period.
The publication presents data on main macroeconomic indicators of the national economy - gross domestic product, investments and finance; and economic activity groupings - industry, agriculture, fore...
Statistical Yearbook 2022
The National Statistical Institute (NSI) has the pleasure to present to the attention of national and foreign users of statistical information the 90th edition of the ‘Statistical Yearbook of the Republic of Bulgaria’ in printed format.
It provides current statistical information about the demographic, economic and social development of the country for 2016 - 2021 in different territorial and classification aggregations and breakdowns.
According to the Law on Statistics, official source of information in the Republic of Bulgaria is the National Statistical ...
Regions, districts and municipalities in the Republic of Bulgaria 2021

The National Statistical Institute offers to the users who are interesting in regional statistics the specialized electronic publication ‘Regions, districts and municipalities in the Republic of Bulgaria 2021’.
The publication contains data about the demographic and socio-economic conditions and environment of Bulgaria’s regions, districts and municipalities in 2021. The most important indicators have been chosen in order to reveal the specifics of the administrative-territorial and territorial units. According to the Classification of Territorial Units for Statistics in Bulgaria ...
Health Services 2022
The National Statistical Institute presents to users of statistical information in the field of the social statistics the annual electronic publication Health Services 2022 (in Bulgarian), a joint edition of the National Statistical Institute and the National Center of Public Health and Analyses at the Ministry of Health.
The data sources are the statistical surveys carried out by the both institutions.
In the publication data are systematized as follows:
• Population and demographic process - main demograp...
Population and Demographic Processes 2021

The NSI’s annual electronic publication Population and Demographic Processes 2021 is available for users of statistical information.
The issue is bilingual (Bulgarian/English) and contains detailed statistical information about the demographic state of the Republic of Bulgaria during the year 2021. Data for the number and structure of the population and for its natural movement and internal migration are published in the issue.
The information about the vital statistics contains data for the marriages, births, deaths, divorces and migration reg...
Statistical Reference Book 2022
The National Statistical Institute presents to users of statistical information the annual publication - Statistical Reference Book 2022 in English.
The Statistical Reference Book presents topical information on the demographic processes as well as the economic, social and cultural development of the Republic of Bulgaria for the 2017 - 2021 period.
The publication presents data on main macroeconomic indicators of the national economy - gross domestic product, investments and finance; and economic activity groupings - industry, agriculture, ...
Bulgaria 2022
The National Statistical Institute presents the bilingual (Bulgarian/English) brochure Bulgaria 2022 to users of statistical information. The brochure is addressed to a wide range of users (international institutions, business, students, experts etc.) and changes the traditional presentation of statistical information by offering an innovative structure with a parallel translation in English. The publication contains topical statistical information about the demographic, social and economic development of the country over the 2016 - 2021 period. It also includes n...
Statistical Reference Book 2022 (Bulgarian version)
The National Statistical Institute presents to users of statistical information the annual publication - Statistical Reference Book 2022 in Bulgarian.
The Statistical Reference Book presents topical information on the demographic processes as well as the economic, social and cultural development of the Republic of Bulgaria for the 2017 - 2021 period.
The publication presents data on main macroeconomic indicators of the national economy - gross domestic product, investments and finance; and economic activity groupings - industry, agriculture, fo...
Statistical Yearbook 2021
The National Statistical Institute (NSI) has the pleasure to present to the attention of national and foreign users of statistical information the 89th edition of the ‘Statistical Yearbook of the Republic of Bulgaria’ in printed and electronic format.
It provides current statistical information about the demographic, economic and social development of the country for 2015 - 2020 in different territorial and classification aggregations and breakdowns.
According to the Law on Statistics, official source of information in the Republic of Bulgaria is the ...
Regions, districts and municipalities in the Republic of Bulgaria 2020
The National Statistical Institute offers to the users who are interesting in regional statistics the specialized electronic publication ‘Regions, districts and municipalities in the Republic of Bulgaria 2020’.
The publication contains data about the demographic and socio-economic conditions and environment of Bulgaria’s regions, districts and municipalities in 2020. The most important indicators have been chosen in order to reveal the specifics of the administrative-territorial and territorial units. According to the Classification of Territorial Units for Statistics in Bulgaria ...
Health Services 2021
The National Statistical Institute presents to users of statistical information in the field of the social statistics the annual electronic publication Health Services 2021 (in Bulgarian), a joint edition of the National Statistical Institute and the National Center of Public Health and Analyses at the Ministry of Health.
The data sources are the statistical surveys carried out by the both institutions.
In the publication data are systematized as follows:
• Population and demographic process - main demograp...
Population and Demographic Processes 2020
The NSI annual electronic publication Population and Demographic Processes 2020 is available for users of statistical information.
The issue is bilingual (Bulgarian/English) and contains detailed statistical information about the demographic state in the Republic of Bulgaria during the year of 2020. Data for the number and the structure of the population and for its natural movement and internal migration are published in the issue.
The information about the vital statistics contains data for the registered during the year marriages, births, deaths, divo...
Statistical Reference Book 2021
The National Statistical Institute presents to users of statistical information the annual publication - Statistical Reference Book 2021 in English.
The Statistical Reference Book presents topical information on the demographic processes as well as the economic, social and cultural development of the Republic of Bulgaria for the 2016 - 2020 period.
The publication presents data on main macroeconomic indicators of the national economy - gross domestic product, investments and finance; and economic activity groupings - industry, agriculture, forestry, ...
Statistical Reference Book 2021 (Bulgarian version)

The National Statistical Institute presents to users of statistical information the annual publication - Statistical Reference Book 2021 in Bulgarian.
The Statistical Reference Book presents topical information on the demographic processes as well as the economic, social and cultural development of the Republic of Bulgaria for the 2016 - 2020 period.
The publication presents data on main macroeconomic indicators of the national economy - gross domestic product, investments and finance; and economic activity groupings - industry, agri...
Statistical Yearbook 2020
The National Statistical Institute (NSI) has the pleasure to present to the attention of national and foreign users of statistical information the 88th edition of the ‘Statistical Yearbook of the Republic of Bulgaria’ in printed and electronic format.
It provides current statistical information about the demographic, economic and social development of the country for 2014 - 2019 in different territorial and classification aggregations and breakdowns.
According to the Law on Statistics, official source of information in the Republic of Bulgaria is the ...
Bulgaria 2021
The National Statistical Institute presents the bilingual (Bulgarian/English) brochure Bulgaria 2021 to users of statistical information. The brochure is addressed to a wide range of users (international institutions, business, students, experts etc.) and changes the traditional presentation of statistical information by offering an innovative structure with a parallel translation in English. The publication contains topical statistical information about the demographic, social and economic development of the country over the 2015 - 2020 period. It also includes non-traditional i...
Regions, districts and municipalities in the Republic of Bulgaria 2019

The National Statistical Institute offers to the users who are interesting in regional statistics the specialized electronic publication ‘Regions, districts and municipalities in the Republic of Bulgaria 2019’.
The publication contains data about the demographic and socio-economic conditions and environment of Bulgaria’s regions, districts and municipalities in 2019. The most important indicators have been chosen in order to reveal the specifics of the administrative-territorial and territorial units. According to the Classification of Territorial Units for Statistics in Bulgaria ...
Health Services 2020

The National Statistical Institute presents to users of statistical information in the field of the social statistics the annual electronic publication Health Services 2020 (in Bulgarian), a joint edition of the National Statistical Institute and the National Center of Public Health and Analyses at the Ministry of Health.
The data sources are the statistical surveys carried out by the both institutions.
In the publication data are systematized as follows:
• Population and demographic process - main demograp...
Statistical Yearbook 2012
The National Statistical Institute (NSI) has the pleasure to submit to the attention of national and foreign users of statistical information the 80th edition of the ‘Statistical Yearbook of the Republic of Bulgaria’ in printed and electronic format.
It provides current statistical information about the demographic, economic and social development of the country for the 2007 - 2011 period in different territorial and classification aggregations and breakdowns.
Accor...
Population and Demographic Processes 2019
The NSI annual electronic publication Population and Demographic Processes 2019 is available for users of statistical information.
The issue is bilingual (Bulgarian/English) and contains detailed statistical information about the demographic state in the Republic of Bulgaria during the year of 2019. Data for the number and the structure of the population and for its natural movement and internal migration are published in the issue.
The information about the vital statistics contains data for the registered during the year marr...
Statistical Reference Book 2020
The National Statistical Institute presents to users of statistical information the annual publication - Statistical Reference Book 2020 in English.
The Statistical Reference Book presents topical information on the demographic processes as well as the economic, social and cultural development of the Republic of Bulgaria for the 2016 - 2019 period.
The publication presents data on main macroeconomic indicators of the national economy - gross domestic product, investments and finance; and economic activity groupings - industry, agriculture, forestry, ...
Statistical Reference Book 2020 (Bulgarian version)
The National Statistical Institute presents to users of statistical information the annual publication - Statistical Reference Book 2020 in Bulgarian.
The Statistical Reference Book presents topical information on the demographic processes as well as the economic, social and cultural development of the Republic of Bulgaria for the 2016 - 2019 period.
The publication presents data on main macroeconomic indicators of the national economy - gross domestic product, investments and finance; and economic activity groupings - industry, agriculture,...
Bulgaria 2020
The National Statistical Institute presents the bilingual (Bulgarian/English) brochure Bulgaria 2020 to users of statistical information. The brochure is addressed to a wide range of users (international institutions, business, students, experts etc.) and changes the traditional presentation of statistical information by offering an innovative structure with a parallel translation in English. The publication contains topical statistical information about the demographic, social and economic development of the country over the 2014 - 2019 period. It also includes non-trad...
Statistical Yearbook 2019
The National Statistical Institute (NSI) has the pleasure to present to the attention of national and foreign users of statistical information the 87th edition of the ‘Statistical Yearbook of the Republic of Bulgaria’ in printed and electronic format.
It provides current statistical information about the demographic, economic and social development of the country for 2013 - 2018 in different territorial and classification aggregations and breakdowns.
According to the Law on Statistics, official source of information in the Republic of Bulgaria is the ...
Regions, districts and municipalities in the Republic of Bulgaria 2018
The National Statistical Institute offers to the users who are interesting in regional statistics the specialized electronic publication ‘Regions, districts and municipalities in the Republic of Bulgaria 2018’.
The publication contains data about the demographic and socio-economic conditions and environment of Bulgaria’s regions, districts and municipalities in 2018. The most important indicators have been chosen in order to reveal the specifics of the administrative-territorial and territorial units. According to the Classification of Territorial Units for Statistics in Bulgaria ...
Health Services 2019
The National Statistical Institute presents to users of statistical information in the field of the social statistics the annual electronic publication Health Services 2019 (in Bulgarian), a joint edition of the National Statistical Institute and the National Center of Public Health and Analyses at the Ministry of Health.
The data sources are the statistical surveys carried out by the both institutions.
In the publication data are systematized as follows:
• Population and demographic process - main demographic indicato...
Population and Demographic Processes 2018

The NSI annual electronic publication Population and Demographic Processes 2018 is available for users of statistical information.
The issue is bilingual (Bulgarian/English) and contains detailed statistical information about the demographic state in the Republic of Bulgaria during the year of 2018. Data for the number and the structure of the population and for its natural movement and internal migration are published in the issue.
The information about the vital statistics contains data for the registered during the year marriages, births,...
Statistical Yearbook 2018 in infographics
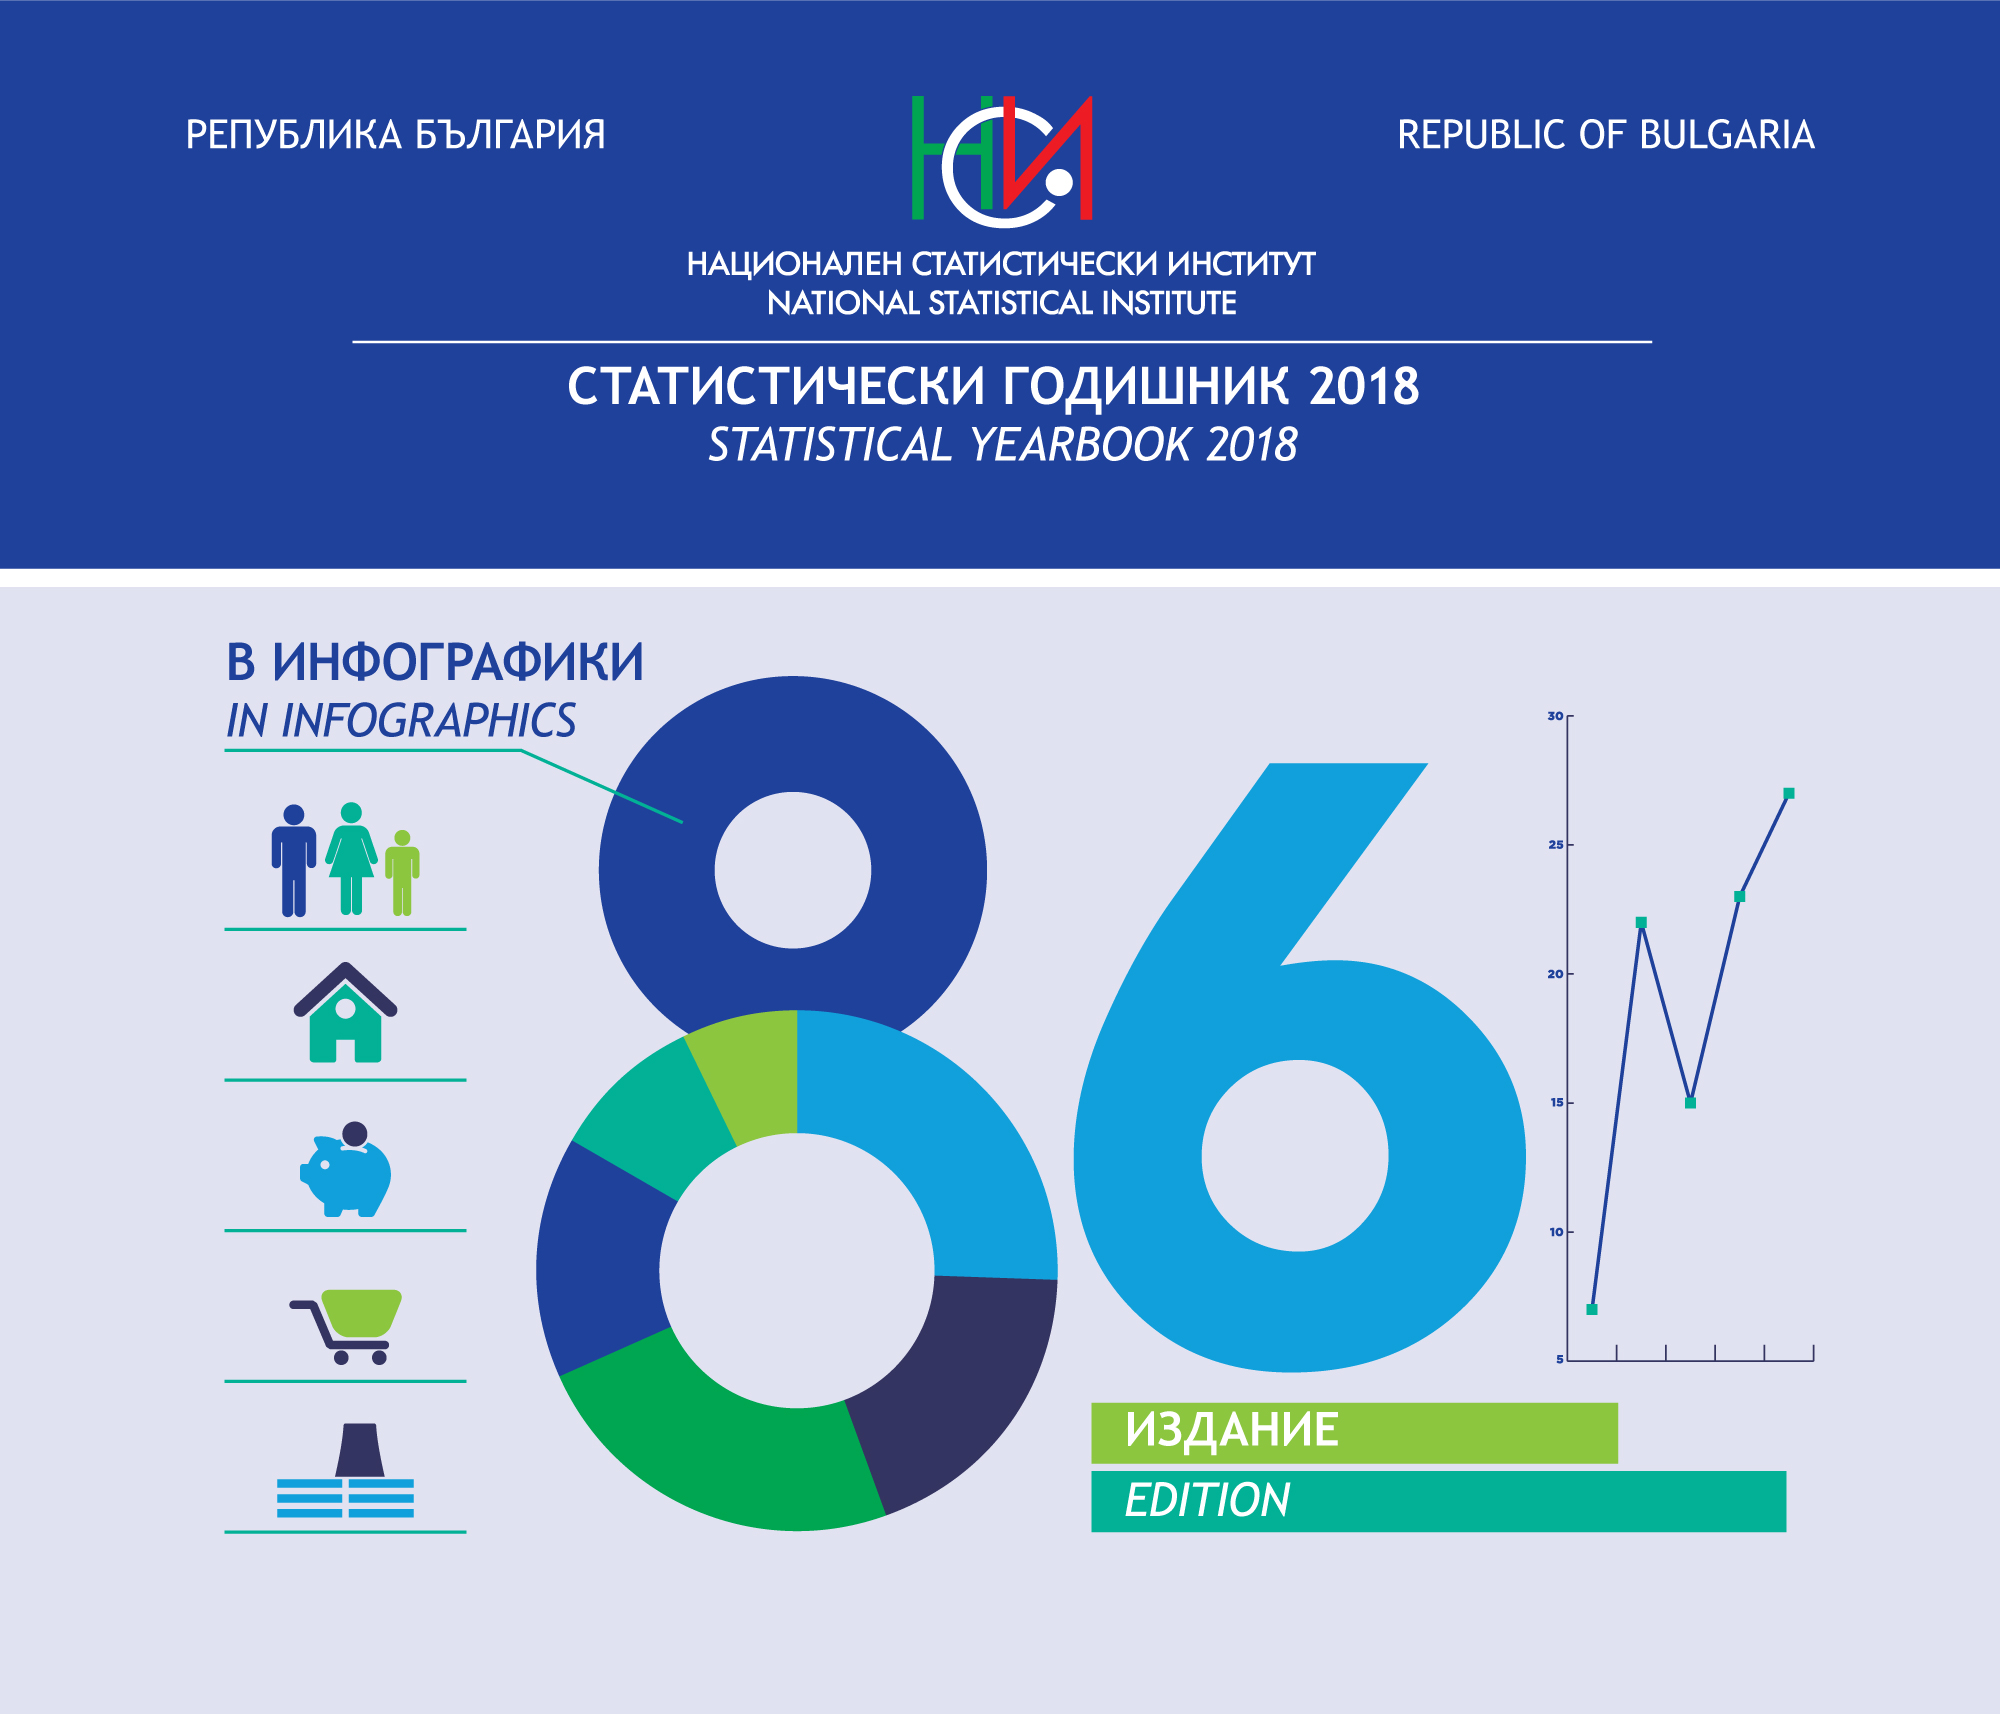
The National Statistical Institute presents to your attention the 86th edition of the Statistical Yearbook of the Republic of Bulgaria in infographics.
In 2018, for the first time, we presented the results of the statistical surveys through graphics, images and other visualization tools, which resulted in a positive response among a wide range of users. We believe that this modern way of presenting statistical information will trigger the interest in those who for the first time encounter the meaning of numbers revealing important aspects of socio-economic life.
...Statistical Reference Book 2019

The National Statistical Institute presents to users of statistical information the annual publication - Statistical Reference Book 2019 in English.
The Statistical Reference Book presents topical information on the demographic processes as well as the economic, social and cultural development of the Republic of Bulgaria for the 2015 - 2018 period.
The publication presents data on main macroeconomic indicators of the national economy - gross domestic product, investments and finance; and economic activity groupings - industry, agriculture, f...
Statistical Reference Book 2019 (Bulgarian version)

The National Statistical Institute presents to users of statistical information the annual publication - Statistical Reference Book 2019 in Bulgarian.
The Statistical Reference Book presents topical information on the demographic processes as well as the economic, social and cultural development of the Republic of Bulgaria for the 2015 - 2018 period.
The publication presents data on main macroeconomic indicators of the national economy - gross domestic product, investments and finance; and economic activity groupings - industry, agriculture, forestry, transp...
Statistical Yearbook 2018

The National Statistical Institute (NSI) has the pleasure to present to the attention of national and foreign users of statistical information the 86th edition of the ‘Statistical Yearbook of the Republic of Bulgaria’ in printed and electronic format.
It provides current statistical information about the demographic, economic and social development of the country for 2012 - 2017 in different territorial and classification aggregations and breakdowns.
According to the Law on Statistics, official source of information in the Republic of Bulgaria is the ...
Regions, districts and municipalities in the Republic of Bulgaria 2017

The National Statistical Institute offers to the users who are interesting in regional statistics the specialized electronic publication ‘Regions, districts and municipalities in the Republic of Bulgaria 2017’.
The publication contains data about the demographic and socio-economic conditions and environment of Bulgaria’s regions, districts and municipalities in 2017. The most important indicators have been chosen in order to reveal the specifics of the administrative-territorial and territorial units. According to the Classification of Territorial Units for Statistics in Bulgaria ...
Health Services 2018
The National Statistical Institute informs users of statistical information in the field of social statistics that the annual publication Health Services 2018 (in Bulgarian only) is already available.
The publication Health Services is a joint edition of the National Statistical Institute and the National Centre for Public Health and Analyses at the Ministry of Health.
The data sources are the statistical surveys carried out by the both institutions.
In the publication data are systematized as follows:
• Population and demographic proces...
Sustainable development of Bulgaria 2005 - 2016
The National Statistical Institute offers to the users the overview publication ‘Sustainable Development of Bulgaria 2005 - 2016’. The publication contains statistical indicators elaborated in conformity with the System of Sustainable Development Indicators developed by EUROSTAT.
The data is systematized in the following sections: Socioeconomic development; Sustainable consumption and production; Social inclusion; Demographic changes; Public health; Climate change and clean energy; Sustainable transport; Natural resources; Global partnership; Good governance.
Main objective ...
Women and Men in the Republic of Bulgaria 2018
The National Statistical Institute presents to users of statistical information the new printed publication ‘Women and Men in the Republic of Bulgaria 2018’.
The issue includes interesting and amusing information about the lives of women and men in our country, about the similarities and differences between them, presented through graphs and tables, short texts and thematic infographics.
The publication is intended for a wide range of users, the state administration, NGO’s and other organizations working in the field of gender equality.
The National Statistical Institu...
Population and Demographic Processes 2017

The NSI annual electronic publication Population and Demographic Processes 2017 is available for users of statistical information.
The issue is bilingual (Bulgarian/English) and contains detailed statistical information about the demographic state in the Republic of Bulgaria during the year of 2017. Data for the number and the structure of the population and for its natural movement and internal migration are published in the issue.
The information about the vital statistics contains data for the registered during the year marriages, births, deaths, divorces...
Statistical Reference Book 2018
The National Statistical Institute presents to users of statistical information the annual publication - Statistical Reference Book 2018 in English.
The Statistical Reference Book presents topical information on the demographic processes as well as the economic, social and cultural development of the Republic of Bulgaria for the 2014 - 2017 period.
The publication presents data on main macroeconomic indicators of the national economy - gross domestic product, investments and finance; and economic activity groupings - industry, agriculture, f...
Statistical Yearbook 2017 in infographics
The National Statistical Institute of Bulgaria offers a different view of the statistical information included in the 85th edition of the Statistical Yearbook of the Republic of Bulgaria.
The publication is intended for a wider audience as statistical data are presented in a plain and easy understandable way.
The current state and changes in the socio-economic and cultural life in the country are presented not in the traditional way in tables and text, but through infographics - images, graphics and other visualization tools.
We belie...
Statistical Reference Book 2018 (Bulgarian version)
The National Statistical Institute presents to users of statistical information the annual publication - Statistical Reference Book 2018 in Bulgarian.
The Statistical Reference Book presents topical information on the demographic processes as well as the economic, social and cultural development of the Republic of Bulgaria for the 2014 - 2017 period.
The publication presents data on main macroeconomic indicators of the national economy - gross domestic product, investments and finance; and economic activity groupings - industry, agriculture, forestry, transp...
Statistical Yearbook 2017
The National Statistical Institute (NSI) has the pleasure to present to the attention of national and foreign users of statistical information the 84th edition of the ‘Statistical Yearbook of the Republic of Bulgaria’ in printed and electronic format.
It provides current statistical information about the demographic, economic and social development of the country for 2012 - 2016 in different territorial and classification aggregations and breakdowns.
According to the Law on Statistics, official source of information in the Republic of Bulgaria is the ...
Bulgaria 2018
The National Statistical Institute presents the bilingual (Bulgarian/English) brochure Bulgaria 2018 to users of statistical information. The brochure is addressed to a wide range of users (international institutions, business, students, experts etc.) and changes the traditional presentation of statistical information by offering an innovative structure with a parallel translation in English. The publication contains topical statistical information about the demographic, social and economic development of the country over the 2013 - 2017 period. It also includes non-trad...
Regions, districts and municipalities in the Republic of Bulgaria 2016
The National Statistical Institute offers to the users who are interesting in regional statistics the specialized electronic publication ‘Regions, districts and municipalities in the Republic of Bulgaria 2016’.
The publication contains data about the demographic and socio-economic conditions and environment of Bulgaria’s regions, districts and municipalities in 2016. The most important indicators have been chosen in order to reveal the specifics of the administrative-territorial and territorial units. According to the Classification of Territorial Units for Statistics in Bulgaria ...
Health Services 2017
The National Statistical Institute informs users of statistical information in the field of social statistics that the annual publication Health Services 2017 (in Bulgarian only) is already available.
The publication Health Services is a joint edition of the National Statistical Institute and the National Centre for Public Health and Analyses at the Ministry of Health.
The data sources are the statistical surveys carried out by the both institutions.
In the publication data are systematized as follows:
• Population and demographic proces...
Population and Demographic Processes 2016
The NSI annual electronic publication Population and Demographic Processes 2016 is available for users of statistical information.
The issue is bilingual (Bulgarian/English) and contains detailed statistical information about the demographic state in the Republic of Bulgaria during the year of 2016. Data for the number and the structure of the population and for its natural movement and internal migration are published in the issue.
The information about the vital statistics contains data for the registered during the year marriages, births,...
Statistical Reference Book 2017
The National Statistical Institute presents to users of statistical information the annual publication - Statistical Reference Book 2017 in English.
The Statistical Reference Book presents topical information on the demographic processes as well as the economic, social and cultural development of the Republic of Bulgaria for the 2013 - 2016 period.
The publication presents data on main macroeconomic indicators of the national economy - gross domestic product, investments and finance; and economic activity groupings - industry, agriculture, f...
Statistical Reference Book 2017 (Bulgarian version)
The National Statistical Institute presents to users of statistical information the annual publication - Statistical Reference Book 2017 in Bulgarian.
The Statistical Reference Book presents topical information on the demographic processes as well as the economic, social and cultural development of the Republic of Bulgaria for the 2013 - 2016 period.
The publication presents data on main macroeconomic indicators of the national economy - gross domestic product, investments and finance; and economic activity groupings - industry, agriculture, forestry, transp...
Bulgaria 2017
The National Statistical Institute presents the bilingual (Bulgarian/English) brochure Bulgaria 2017 to users of statistical information. The brochure is addressed to a wide range of users (international institutions, business, students, experts etc.) and changes the traditional presentation of statistical information by offering an innovative structure with a parallel translation in English. The publication contains topical statistical information about the demographic, social and economic development of the country over the 2012 - 2016 period. It also includes non-traditional i...
Statistical Yearbook 2016
The National Statistical Institute (NSI) has the pleasure to present to the attention of national and foreign users of statistical information the 84th edition of the ‘Statistical Yearbook of the Republic of Bulgaria’ in printed and electronic format.
It provides current statistical information about the demographic, economic and social development of the country for 2011 - 2015 in different territorial and classification aggregations and breakdowns.
According to the Law on Statistics, official source of information in the Republic of Bulgaria is the ...
Regions, districts and municipalities in the Republic of Bulgaria 2015
The National Statistical Institute offers to the users who are interesting in regional statistics the specialized electronic publication ‘Regions, districts and municipalities in the Republic of Bulgaria 2015’.
The publication contains data about the demographic and socio-economic conditions and environment of Bulgaria's regions, districts and municipalities in 2015. The most important indicators have been chosen in order to reveal the specifics of the administrative-territorial and territorial units. According to the Classification of Territorial Units for Statistics in Bulgaria ...
Health Services 2016
The National Statistical Institute informs users of statistical information in the field of social statistics that the annual publication Health Services 2016 (in Bulgarian only) is already available.
The publication Health Services is a joint edition of the National Statistical Institute and the National Centre for Public Health and Analyses at the Ministry of Health.
The data sources are the statistical surveys carried out by the both institutions.
In the publication data are systematized as follows:
Population and Demographic Processes 2015

The NSI annual electronic publication Population and Demographic Processes 2015 is available for users of statistical information.
The issue is bilingual (Bulgarian/English) and contains detailed statistical information about the demographic state in the Republic of Bulgaria during the year of 2015. Data for the number and the structure of the population and for its natural movement and internal migration are published in the issue.
The information about the vital statistics contains data for the registered during the year marriages, births,...
Statistical Reference Book 2016

The National Statistical Institute presents to users of statistical information the annual publication - Statistical Reference Book 2016 in English.
The Statistical Reference Book presents topical information on the demographic processes as well as the economic, social and cultural development of the Republic of Bulgaria for the 2012 - 2015 period.
The publication presents data on main macroeconomic indicators of the national economy - gross domestic product, investments and finance; and economic activity groupings - industry, agriculture, forestry, transpor...
Statistical Reference Book 2016 (Bulgarian version)

The National Statistical Institute presents to users of statistical information the annual publication - Statistical Reference Book 2016 in Bulgarian.
The Statistical Reference Book presents topical information on the demographic processes as well as the economic, social and cultural development of the Republic of Bulgaria for the 2012 - 2015 period.
The publication presents data on main macroeconomic indicators of the national economy - gross domestic product, investments and finance; and economic activity groupings - industry, agriculture, forestry, transp...
Bulgaria 2016
The National Statistical Institute presents the bilingual (Bulgarian/English) brochure Bulgaria 2016 to users of statistical information. The brochure is addressed to a wide range of users (international institutions, businessmen, students, experts etc.) and changes the traditional presentation of statistical information by offering an innovative structure with a parallel translation in English. The publication contains topical statistical information about the demographic, social and economic development of the country over the 2011 - 2015 period. It also includes non-traditiona...
Statistical Yearbook 2015
The National Statistical Institute (NSI) has the pleasure to present to the attention of national and foreign users of statistical information the 83rd edition of the ‘Statistical Yearbook of the Republic of Bulgaria’ in printed and electronic format.
It provides current statistical information about the demographic, economic and social development of the country for 2010 - 2014 in different territorial and classification aggregations and breakdowns.
According to the Law on Statistics, official source of information in the Republic of Bulgaria is the ...
Regions, districts and municipalities in the Republic of Bulgaria 2014
The National Statistical Institute offers to the users who are interesting in regional statistics the specialized electronic publication ‘Regions, districts and municipalities in the Republic of Bulgaria 2014’.
The publication contains data about the demographic, socio-economic and environmental condition of Bulgaria's regions, districts and municipalities in 2014. The most important indicators have been chosen in order to reveal the specifics of the administrative-territorial and territorial units. According to the Classification of Territorial Units for Statistics in Bulgaria th...
Health Services 2015

The National Statistical Institute informs users of statistical information in the field of social statistics that the annual publication Health Services 2015 (in Bulgarian only) is already available.
The publication Health Services is a joint edition of the National Statistical Institute and the National Centre for Public Health and Analyses at the Ministry of Health.
The data sources are the statistical surveys carried out by the both institutions.
In the publication data are systematized as follows:
• Popu...
Population and Demographic Processes 2014
The NSI annual electronic publication Population and Demographic Processes 2014 is available for users of statistical information.
The issue is bilingual (Bulgarian/English) and contains detailed statistical information about the demographic state in the Republic of Bulgaria during the year of 2014. Data for the number and the structure of the population and for its natural movement and internal migration are published in the issue.
The information about the vital statistics contains data for the registered during the year marriages, births, dea...
Statistical Reference Book 2015
The National Statistical Institute presents to users of statistical information the annual publication - Statistical Reference Book 2015 in English.
The Statistical Reference Book presents topical information on the demographic processes as well as the economic, social and cultural development of the Republic of Bulgaria for the 2010 - 2014 period.
The publication presents data on main macroeconomic indicators of the national economy - gross domestic product, investments and finance; and economic activity groupings - industry, agriculture, forestry, transport, c...
Statistical Reference Book 2015 (Bulgarian version)
The National Statistical Institute presents to users of statistical information the annual publication - Statistical Reference Book 2015 in Bulgarian.
The Statistical Reference Book presents topical information on the demographic processes as well as the economic, social and cultural development of the Republic of Bulgaria for the 2010 - 2014 period.
The publication presents data on main macroeconomic indicators of the national economy - gross domestic product, investments and finance; and economic activity groupings - industry, agriculture, forestry, transport,...
Bulgaria 2015
The National Statistical Institute presents the bilingual (Bulgarian/English) brochure Bulgaria 2015 to users of statistical information. The brochure is addressed to a wide range of users (international institutions, businessmen, students, experts etc.) and changes the traditional presentation of statistical information by offering an innovative structure with a parallel translation in English. The publication contains topical statistical information about the demographic, social and economic development of the country over the 2010 - 2014 period. It also includes non-tra...
Statistical Yearbook 2014
The National Statistical Institute (NSI) has the pleasure to present to the attention of national and foreign users of statistical information the 82nd edition of the ‘Statistical Yearbook of the Republic of Bulgaria’ in printed and electronic format.
It provides current statistical information about the demographic, economic and social development of the country for 2009 - 2013 in different territorial and classification aggregations and breakdowns.
According to the Law on Statistics, official source of information in the Republic of Bulgaria is the Nati...
Regions, districts and municipalities in the Republic of Bulgaria 2013
The National Statistical Institute offers to the users who are interesting in regional statistics the specialized electronic publication ‘Regions, districts and municipalities in the Republic of Bulgaria 2013’.
The publication contains data about the demographic, socio-economic and environmental condition of Bulgaria's regions, districts and municipalities in 2013. The most important indicators have been chosen in order to reveal the specifics of the administrative-territorial and territorial units. According to the Classification of Territorial Units for Statistics in Bulgaria the te...
Health Services 2014
The National Statistical Institute informs users of statistical information in the field of social statistics that the annual publication Health Services 2014 (in Bulgarian only) is already available.
The publication Health Services is a joint edition of the National Statistical Institute and the National Centre for Public Health and Analyses at the Ministry of Health.
The data sources are the statistical surveys carried out by the both institutions.
In the publication data are systematized as follows:...
Population and Demographic Processes 2013

The NSI annual electronic publication Population and Demographic Processes 2013 is available for users of statistical information.
The issue is bilingual (Bulgarian/English) and contains detailed statistical information about the demographic state in the Republic of Bulgaria during the year of 2013. Data for the number and the structure of the population and for its natural movement and internal migration are published in the issue.
The information about the vital statistics contains data for the registered during the year marriages, births, deaths, divo...
Statistical Reference Book 2014

The National Statistical Institute presents to users of statistical information the annual publication - Statistical Reference Book 2014 in English.
The Statistical Reference Book presents topical information on the demographic processes as well as the economic, social and cultural development of the Republic of Bulgaria for the 2009 - 2013 period.
The publication presents data on main macroeconomic indicators of the national economy - gross domestic product, investments and finance; and economic activity groupings - industry, agriculture, forestry, tran...
Statistical Reference Book 2014 (Bulgarian version)

The National Statistical Institute presents to users of statistical information the annual publication - Statistical Reference Book 2014 in Bulgarian.
The Statistical Reference Book presents topical information on the demographic processes as well as the economic, social and cultural development of the Republic of Bulgaria for the 2009 - 2013 period.
The publication presents data on main macroeconomic indicators of the national economy - gross domestic product, investments and finance; and economic activity groupings - industry, agriculture, forestry, tr...
Bulgaria 2014

The National Statistical Institute presents the bilingual (Bulgarian/English) brochure Bulgaria 2014 to users of statistical information. The brochure is addressed to a wide range of users (international institutions, businessmen, students, experts etc.) and changes the traditional presentation of statistical information by offering an innovative structure with a parallel translation in English. The publication contains topical statistical information about the demographic, social and economic development of the country over the 2008 - 2013 period. It also includes non-traditional ...
Statistical Yearbook 2013

The National Statistical Institute (NSI) has the pleasure to present to the attention of national and foreign users of statistical information the 81st edition of the ‘Statistical Yearbook of the Republic of Bulgaria’ in printed and electronic format.
It provides current statistical information about the demographic, economic and social development of the country for 2008 - 2012 in different territorial and classification aggregations and breakdowns.
According to the Law on Statistics, official source of information in the Republic of Bulgaria is the Nati...
Regions, districts and municipalities in the Republic of Bulgaria 2012
The National Statistical Institute offers to the users who are interested in regional statistics the specialized electronic publication „Regions, districts and municipalities in the Republic of Bulgaria 2012”.
The publication contains data about the demographic, socio-economic and environmental condition of Bulgaria's regions, districts and municipalities in 2012. The most important indicators have been chosen in order to reveal the specifics of the administrative-territorial and territorial units. According to the Classification of Territorial Units for Statistics in...
Health Services 2013
The National Statistical Institute informs users of statistical information in the field of social statistics that the annual publication Health Services 2013 (in Bulgarian only) is already available.
The publication Health Services is a joint edition of the National Statistical Institute and the National Centre for Public Health and Analyses at the Ministry of Health.
The data sources are the statistical surveys carried out by the both institutions.
In the publication data are systematized as follows:
...Population and Demographic Processes 2012
The NSI annual electronic publication Population and Demographic Processes 2012 is available for users of statistical information.
The issue is bilingual (Bulgarian/English) and contains detailed statistical information about the demographic state in the Republic of Bulgaria during the year of 2012. Data for the number and the structure of the population and for its natural movement and internal migration are published in the issue.
The information about the vital statistics contains data for the registered during the year marriages, bir...
Regions, Districts and Municipalities in the Republic of Bulgaria 2011
The National Statistical Institute offers to the users who are interested in regional statistics the specialized electronic publication „Regions, Districts and Municipalities in the Republic of Bulgaria 2011”.
The publication contains data about the demographic, socio-economic and environmental condition of Bulgaria's regions, districts and municipalities in 2011. The most important indicators have been chosen in order to reveal the specifics of the administrative-territorial and territorial units. According to the Classification of Territorial Units for Stat...
Statistical Reference Book 2013
The National Statistical Institute presents to users of statistical information the annual publication - Statistical Reference Book 2013 in English.
The Statistical Reference Book presents topical information on the demographic processes as well as the economic, social and cultural development of the Republic of Bulgaria for the 2008 - 2012 period.
The publication presents data on main macroeconomic indicators of the national economy - gross domestic product, investments and finance; and economic activity groupings - industry, agric...
Statistical Reference Book 2013 (Bulgarian version)

The National Statistical Institute presents to users of statistical information the annual publication - Statistical Reference Book 2013 in Bulgarian.
The Statistical Reference Book presents topical information on the demographic processes as well as the economic, social and cultural development of the Republic of Bulgaria for the 2008 - 2012 period.
The publication presents data on main macroeconomic indicators of the national economy - gross domestic product, investments and finance; and economic activity groupings - industry, agr...
Bulgaria 2013

The National Statistical Institute presents the bilingual (Bulgarian/English) brochure Bulgaria 2013 to users of statistical information. The brochure is addressed to a wide range of users (international institutions, businessmen, students, experts etc.) and changes the traditional presentation of statistical information by offering an innovative structure with a parallel translation in English. The publication contains topical statistical information about the demographic, social and economic development of the country over the 2007 - 2012 period. It also inc...
Health Services 2012

The National Statistical Institute informs users of statistical information in the field of social statistics that the annual publication Health Services 2012 (in Bulgarian only) is already available.
The publication Health Services is a joint edition of the National Statistical Institute and the National Centre for Public Health and Analyses at the Ministry of Health.
The data sources are the statistical surveys carried out by the both institutions.
In the publication data are systematized as follows:
...Population and Demographic Processes 2011

The NSI annual electronic publication Population and Demographic Processes 2011 is available for users of statistical information.
The issue is bilingual (Bulgarian/English) and contains detailed statistical information about the demographic state in the Republic of Bulgaria during the year of 2011. Data for the number and the structures of the population and for its natural movement and internal migration are published in the issue.
The information about the vital statistics contains data for the registered during the year marriage...
Statistical Reference Book 2012

The National Statistical Institute presents to users of statistical information the annual publication - Statistical Reference Book 2012 in English.
The Statistical Reference Book represents topical information on the demographic processes as well as the economic, social and cultural development of the Republic of Bulgaria for the 2007 - 2011 period.
The publication presents data on main macroeconomic indicators of the national economy - gross domestic product, investments and finance; and economic activity groupings - industry, agr...
Statistical Reference Book 2012 (Bulgarian version)

The National Statistical Institute presents to users of statistical information the annual publication - Statistical Reference Book 2012 in Bulgarian.
The Statistical Reference Book presents topical information on the demographic processes as well as the economic, social and cultural development of the Republic of Bulgaria for the 2007 - 2011 period.
The publication presents data on main macroeconomic indicators of the national economy - gross domestic product, investments and finance; and economic activity groupings&...
Bulgaria 2012
The National Statistical Institute presents the bilingual (Bulgarian/English) brochure Bulgaria 2012 to users of statistical information. The brochure is addressed to a wide range of users (international institutions, businessmen, students, experts etc.) and changes the traditional presentation of statistical information by offering an innovative structure with a parallel translation in English. The publication contains topical statistical information about the demographic, social and economic development of the country over the 2006 - 2011 period. It also inc...
Statistical Yearbook 2011
The National Statistical Institute (NSI) has the pleasure to submit to the attention of national and foreign users of statistical information the 79th edition of the ‘Statistical Yearbook of the Republic of Bulgaria’ in printed and electronic format.
It provides current statistical information about the demographic, economic and social development of the country for the 2005 - 2010 period in different territorial and classification aggregations and breakdowns.
According ...
Regions, Districts and Municipalities in the Republic of Bulgaria 2010
The National Statistical Institute offers to the users who are interested in regional statistics the specialized electronic publication „Regions, Districts and Municipalities in the Republic of Bulgaria 2010”.
The publication contains data about the demographic, socio-economic and environmental condition of Bulgaria's regions, districts and municipalities in 2010. The most important indicators have been chosen in order to reveal the specifics of the administrative-territorial and territorial units. According to the Classification of Territorial Units for Stat...
Health Services 2011
The National Statistical Institute presents to users of statistical information the annual electronic publication Health Services 2011 (in Bulgarian only).
The publication Health Services is a joint edition of the National Statistical Institute and the National Centre for Public Health and Analyses at the Ministry of Health.
The data sources are the statistical surveys carried out by the both institutions.
In the publication data are systematized as follows:
• Population and demographic process - main demographic in...
Population and Demographic Processes 2010

The NSI annual electronic publication Population and Demographic Processes 2010 is available for users of statistical information.
The issue is bilingual (Bulgarian/English) and contains detailed statistical information about the demographic state in the Republic of Bulgaria during the year of 2010. Data for the number and the structures of the population and for its natural movement and internal migration are published in the issue.
The information about the vital statistics contains data for the registered during the year marriages, births,...
Statistical Reference Book 2011
The National Statistical Institute presents to users of statistical information the annual publication - Statistical Reference Book 2011 in English. It is a concise form of the same issue in Bulgarian.
The Statistical Reference Book presents topical information on the demographic processes as well as the economic, social and cultural development of the Republic of Bulgaria for the 2006 - 2010 period.
The publication presents data on main macroeconomic indicators of the national economy - gross domestic product, investments...
Bulgaria 2011

The National Statistical Institute presents the bilingual (Bulgarian/English) brochure Bulgaria 2011 to users of statistical information. The brochure is addressed to a wide range of users (international institutions, businessmen, students, experts etc.) and changes the traditional presentation of statistical information by offering an innovative structure with a parallel translation in English. The publication contains topical statistical information about the demographic, social and economic development of the country over the 2005 - 2010 period. It als...
Statistical Yearbook 2010
The National Statistical Institute (NSI) has the pleasure to submit to the attention of national and foreign users of statistical information the 78th edition of the ‘Statistical Yearbook of the Republic of Bulgaria’ in printed and electronic format.
It provides current statistical information about the demographic, economic and social development of the country for the 2004 - 2009 period in different territorial and classification aggregations and breakdowns.
Accor...
Statistical Yearbook 2009
The National Statistical Institute (NSI) has the pleasure to submit to the attention of national and foreign users of statistical information the 77th edition of the ‘Statistical Yearbook of the Republic of Bulgaria’ in printed and electronic format. The issue is published in 2010, which marks 130 years since the establishment of a statistical institution in Bulgaria and 100 years since publishing of the first ‘Statistical Yearbook of the Bulgarian Kingdom’ in 1910.
This issue has new design and layout. It provides current statistical information about ...
Population and Demographic Processes 2009
The NSI annual electronic publication Population and Demographic Processes 2009 is available for users of statistical information.
The issue is bilingual (Bulgarian/English) and contains detailed statistical information about the demographic state in the Republic of Bulgaria during the year of 2009. Data for the number and the structures of the population and for its natural movement and internal migration are published in the issue.
The information about the vital statistics contains data for the registered during the year marriages, births, deaths...
Health Sevices 2010
The National Statistical Institute informs users of statistical information in the field of social statistics that the annual publication Health Services 2010 (in Bulgarian only) is already available.
The publication Health Services is a joint edition of the National Statistical Institute and the National Centre for Health Information at the Ministry of Health.
The data sources are the statistical surveys carried out by the both institutions.
In the publication data are systematized as follows:
Statistical Reference Book 2010

The National Statistical Institute presents to users of statistical information the annual publication - Statistical Reference Book 2010 in English. It is a concise form of the same issue in Bulgarian.
The Statistical Reference Book presents topical information on the demographic processes as well as the economic, social and cultural development of the Republic of Bulgaria for the 2005 - 2009 period.
The publication presents data on main macroeconomic indicators of the national economy - gross domestic product, investments...
Bulgaria 2010
The National Statistical Institute presents the bilingual (Bulgarian/English) brochure Bulgaria 2010 to users of statistical information. The brochure is addressed to a wide range of users (international institutions, businessmen, students, experts etc.) and changes the traditional presentation of statistical information by offering an innovative structure with a parallel translation in English. The publication contains topical statistical information about the demographic, social and economic development of the country over the 2003 - 2009 period. It also inc...
Health Services 2009
The National Statistical Institute informs users of statistical information in the field of social statistics that the annual publication Health Services 2009 (in Bulgarian only) is already available.
The publication Health Services is a joint edition of the National Statistical Institute and the National Centre of Health Information at the Ministry of Health.
The data sources are the statistical surveys carried out by the both institutions.
In the publication data are systematized as follows:
...
Sustainable Development of Bulgaria 2008
The National Statistical Institute offers to the users of statistical information the annual publication “Sustainable Development of Bulgaria 2008”. The issue is bilingual (Bulgarian/English) and is structured in sections and subsections, as each subsection contains short analytical text and charts.
The information is systematized in the following sections:
- Socioeconomic development;
- Sustainable consumption and production;
- Social inclusion;
- Demographic changes;
- Public health;
- Climate chang...
Regions, Districts and Municipalities in the Republic of Bulgaria 2008
The National Statistical Institute offers users who are interested in regional statistics the new specialized electronic publication 'Regions, Districts and Municipalities in the Republic of Bulgaria 2008' (on a CD).
The publication contains data about the demographic, socio-economic and environmental state of Bulgaria's regions, districts and municipalities in 2008. It is a continuation of the annual NSI's electronic publications containing regional data. The most important indicators have been chosen in order to reveal the specifics of the different ...
Population and Demographic Processes 2008
The National Statistical Institute presents the annual publication Population and Demographic Processes 2008 to users of statistical information.
The issue is bilingual (Bulgarian/English) and contains detailed statistical information about the demographic state in the Republic of Bulgaria during the year of 2008. Data for the number and the structures of the population and for its natural movement and internal migration are published in the issue.
The information about the vital statistics contains data for the registered during the year marriages,...
Statistical Reference Book 2009
The National Statistical Institute presents to users of statistical information the annual publication - Statistical Reference Book 2009 in English. It is a concise form of the same issue in Bulgarian.
The issue is with a new design and enrich contents. For the first time are included methodological and analytic notes towards all chapters. The information is illustrated with a rich graphic materials.
The Statistical Reference Book presents topical information on the demographic processes as well as the economic, social and cultural ...
Bulgaria 2009
The National Statistical Institute presents the bilingual (Bulgarian/English) brochure Bulgaria 2009 to users of statistical information. The brochure is addressed to a wide range of users (international institutions, businessmen, students, experts etc.) and changes the traditional presentation of statistical information by offering an innovative structure with a parallel translation in English. The publication contains topical statistical information about the demographic, social and economic development of the country over the 2003 - 2008 period. It also inc...
Statistical Yearbook 2008
The National Statistical Institute has the pleasure to submit to the attention of national and foreign users of statistical information the 76th edition of the Statistical Yearbook of the Republic of Bulgaria 2008. It provides topical statistical information on the demographic, economic and social development of the country for the 2002 - 2007 period in different territorial and classification aggregations and breakdowns.
According to the Law on Statistics, official source of information in the Republic of Bulgaria is the National Statistical System, wh...
Regions, Districts and Municipalities in the Republic of Bulgaria 2007
The National Statistical Institute offers users who are interested in regional statistics the new specialized electronic publication 'Regions, Districts and Municipalities in the Republic of Bulgaria 2007' (on a CD).
The publication contains data about the demographic, socio-economic and environmental state of Bulgaria's regions, districts and municipalities in 2007. It is a continuation of the annual NSI's electronic publications containing regional data. The most important indicators have been chosen in order to reveal the specifics of the different ...
Health Services 2008
The National Statistical Institute informs users of statistical information in the field of social statistics that the annual publication Health Services 2008 (in Bulgarian only) is already available.
The publication Health Services is a joint edition of the National Statistical Institute and the National Centre of Health Information at the Ministry of Health.
The data sources are the statistical surveys carried out by the both institutions.
In the publication data are systematized as follows:
• P...
Population and Demographic Processes 2007
The National Statistical Institute presents the annual publication Population and demographic processes 2007 to users of statistical information.
The issue is bilingual (Bulgarian/English) and contains detailed statistical information about the demographic state in the Republic of Bulgaria during the year of 2007. Data for the number and the structures of the population and for its natural movement and internal migration are published in the issue.
The information about the vital statistics contains data for the registered during the year mar...
Sustainable Development of Bulgaria 2007

The National Statistical Institute offers to the users of statistical information the new annual publication Sustainable Development of Bulgaria 2007. The issue is bilingual (Bulgarian/English) and is structured in sections and subsections, as each subsection contains short analytical text and charts.
The information is systematized in the following sections:
• Socioeconomic development;
• Sustainable consumption and production;
• Social inclusion;...
Population 2007
The National Statistical Institute informs users of statistical information that the bilingual publication (in English and Bulgarian) Population 2007 is already available. The issue contains information on the demographic status of the Republic of Bulgaria in 2007. Data on the number of the population by sex and age as well as its natural movement and internal migration are published in the publication.
The publication includes information on the number of the population at the end of the year and the average annual population in the respective year....
Regions and Districts in the Republic of Bulgaria 2002 - 2006
The National Statistical Institute presents to the users of statistical information the printed publication Regions and Districts in the Republic of Bulgaria 2002 - 2006. The issue is bilingual (Bulgarian/English) and contains data about the demographic, social, economic and environmental state of the Bulgarian districts and planning regions for the period 2002 - 2006. Regarding the districts (to a certain extent comparable with the former 'okrazi') the publication is a continuation of the NSI publication for the period 1997 - 2001. Bulgaria's pla...
Statistical Reference Book of the Republic of Bulgaria 2008
The National Statistical Institute presents to users of statistical information one of its main publications - Statistical Reference Book of the Republic of Bulgaria 2008 in English. It is a concise form of the same issue in Bulgarian.
The Statistical Reference Book presents topical information on the demographic processes as well as the economic, social and cultural development of the Republic of Bulgaria for the 2004 - 2007 period.
The publication presents data on main macroeconomic indicators of the national economy - gross dom...


