Number of local units
| SECTIONS BY NACE Rev.2 | Total | Statistical regions | |||||
|---|---|---|---|---|---|---|---|
| Severozapaden | Severen tsentralen | Severoiztochen | Yugoiztochen | Yugozapaden | Yuzhen tsentralen | ||
| Mining and quarrying | 404 | 48 | 25 | 36 | 56 | 144 | 95 |
| Manufacturing | 32 334 | 2 704 | 3 680 | 3 722 | 4 150 | 10 198 | 7 880 |
| Electricity, gas, steam and air conditioning supply | 4 566 | 708 | 498 | 364 | 948 | 1 203 | 845 |
| Water supply; sewerage, waste management and remediation activities | 1 046 | 105 | 121 | 122 | 134 | 387 | 177 |
| Construction | 23 670 | 1 192 | 1 681 | 3 104 | 3 135 | 10 823 | 3 735 |
| Wholesale and retail trade; repair of motor vehicles and motorcycles | 159 845 | 13 108 | 15 325 | 20 026 | 23 992 | 55 509 | 31 885 |
| Transportation and storage | 23 902 | 1 872 | 2 466 | 2 700 | 3 353 | 9 479 | 4 032 |
| Accommodation and food service activities | 27 898 | 2 152 | 2 225 | 3 282 | 5 764 | 9 231 | 5 244 |
| Information and communication | 18 636 | 734 | 1 053 | 1 909 | 1 375 | 11 577 | 1 988 |
| Real estate activities | 28 324 | 1 187 | 1 824 | 4 430 | 3 965 | 13 152 | 3 766 |
| Professional, scientific and technical activities | 49 706 | 1 868 | 2 927 | 5 451 | 4 709 | 28 428 | 6 323 |
| Administrative and support service activities | 12 584 | 605 | 895 | 1 663 | 1 593 | 6 134 | 1 694 |
| Education | 4 311 | 234 | 310 | 478 | 385 | 2 317 | 587 |
| Human health and social work activities | 15 612 | 1 426 | 1 520 | 1 974 | 2 063 | 5 565 | 3 064 |
| Arts, entertainment and recreation | 5 977 | 263 | 379 | 826 | 795 | 2 918 | 796 |
| Repair of computers and personal and household goods | 3 193 | 251 | 363 | 474 | 514 | 1 026 | 565 |
| Other personal service activities | 23 243 | 1 344 | 1 905 | 3 318 | 3 746 | 8 699 | 4 231 |
*) The annual data by statistical regions are calculated from local units following the methodology on Structural business statistics. |
|||||||
28.06.2024
Euro-SDMX Metadata Structure (ESMS)
| Contact | |
|---|---|
| Contact organisation | National Statistical Institute |
| Contact organisation unit | 'Annual Business Statistics' Department |
| Contact name | Maya Simeonova |
| Contact person function | Head of department |
| Contact mail address | 2, P. Volov Str.; 1038 Sofia, Bulgaria |
| Contact email address | mysimeonova@nsi.bg
|
| Contact phone number | +359 2 9857 179 |
| Contact fax number | |
| Metadata update | |
| Metadata last certified | 03 October 2014 |
| Metadata last posted | 03 October 2014 |
| Metadata last update | 03 October 2014 |
| Statistical presentation | |
| Data description | Starting reference year 2021 onwards SBS cover the economic activities of market producers within the NACE Rev. 2 Sections B to N, P to R and Divisions S95 and S96. The SBS survey of non-financial enterprises covers sections B to N (excluding K) and division S95, according to NACE.BG-2008, which are divided into four annexes - Industry (B, C, D and E), Construction (F), Distributive Trades (G) and Services (H, I, J, L, M, N and S95). For the period 2002 - 2007 the data were compiled by NACE.BG-2003 and were observed only sections C to I and section K. Since 2008 the data are compiled by NACE.BG-2008. The annual data of non-financial enterprises are aggregated by sections (the first sign of NACE.BG-2008 and NACE.BG-2003). The annual data, grouping by size class: the indicators are published on section level (the first sign of NACE.BG-2008 and NACE.BG-2003) and by size class of employment. Annual regional data: Three indicators are published on a regional level by sections (the first sign of NACE.BG-2008 and NACE.BG-2003) and by statistical regions (NUTS). The type and the content of the indicators and the aggregate levels are fully compliant with the European regulations on SBS, detailed in 'Legal acts and rules'. |
| Classification system |
|
| Sector coverage | Starting reference year 2021 onwards SBS cover the economic activities of market producers within the NACE Rev. 2 Sections B to N, P to R and Divisions S95 and S96. Non-financial enterprises, classified in sections B to N (excluding K) and division S95 by NACE.BG-2008 from 2008 onwards, sections C to I and section K by NACE.BG-2003 for the period 2002 - 2007. |
| Statistical concepts and definitions | The main SBS indicators are:
|
| Statistical unit | SBS data refer to statistical unit enterprise. |
| Statistical population | Starting reference year 2021 onwards SBS cover the economic activities of market producers within the NACE Rev. 2 Sections B to N, P to R and Divisions S95 and S96. The SBS survey is exhaustive and the statistical population includes all non-financial enterprises classified in sections B to N (excluding K) and division S95 by NACE.BG-2008 from 2008 onwards, sections C to I and section K by NACE.BG-2003 for the period 2002 - 2007. |
| Reference area | The data refer to the activities of non-financial enterprises carried out in the country. |
| Time coverage | Since 2008 (the data are calculated by NACE.BG-2008); 2002-2007 (the data are calculated by NACE.BG-2003). |
| Base period | Not applicable. |
| Unit of measure | |
| |
| Reference period | |
Calendar year | |
| Institutional mandate | |
| Legal acts and other agreements | European SBS Regulations:
Bulgarian legislation:
|
| Data sharing | The SBS data are provided to Eurostat in accordance with the SBS Regulations. The same data are used to fill other international questionnaires (UNIDO) and data exchange under signed agreements, ensuring the protection of confidential information. |
| Confidentiality | |
| Confidentiality - policy | Regulation (EC) № 223/2009 of 11 March 2009 defines common criteria for protection of confidential data and methods for sending the information to and its use by Eurostat. The Law on Statistics ensures the protection of statistical confidentiality and the use of individual data of enterprises for statistical purposes only. |
| Confidentiality - data treatment | The individual (primary) data are confidential according to the Law on Statistics and European legislation. To ensure their protection and inability to be identified, the aggregated indicators are also defined as confidential when:
|
| Release policy | |
| Release calendar | The data are published in accordance with the deadline specified in the Release Calendar presenting the results of the statistical surveys carried out by the National Statistical Institute. |
| Release calendar access | The calendar is available on the NSI website: https://www.nsi.bg/en/node/480 |
| User access | Data are published on the NSI website and are available to all users of statistical information. |
| Frequency of dissemination | |
Yearly | |
| Accessibility and clarity | |
| News release | Regular press release for the preliminary SBS data. |
| Publications |
|
| On-line database | The SBS data are available to all users of the NSI website under the heading Business statistics - Annual Business Statistics - Structural Business Statistics - Non-financial Enterprises:
|
| Micro-data access | Not available. |
| Other | Information service on request, according to the Rules for dissemination of statistical products and services of NSI. |
| Documentation on methodology | Eurostat's methodological manual concerning SBS data, based on the European legislation on SBS and the harmonised national legislation in the same field: https://www.nsi.bg/sites/default/files/files/metadata/SBS_Methodology_KID2008_NF_2_EN.pdf |
| Quality documentation | National quality reports according to the SBS Regulations: https://www.nsi.bg/en/node/8057 |
| Quality management | |
| Quality assurance | This includes the improvement of the on-line based information system 'Business statistics', which ensures strict arithmetical and logical input control. The additional output control is made when are registered the big differences in the value of given indicator between two consecutive years or in comparison with the results of other statistical surveys in NSI - Short-term statistics, statistics Prodcom, Foreign trade, Labor force. |
| Quality assessment | This is made in accordance with the standard criteria for assessing the quality - relevance, accuracy and reliability, timeliness, comparability and coherence. |
| Relevance | |
| User needs | The main users of SBS data are:
|
| User satisfaction | There has been no study of user satisfaction, but no cases of outstanding requests for information are registered. |
| Completeness | For the period 2002-2008 the requirements of European regulations are met with a few exceptions, but since 2009 the compliance has been 100%. |
| Accuracy and reliability | |
| Overall accuracy | The statistical data have good accuracy and reliability. |
| Sampling error | The SBS survey is exhaustive and there are no sampling errors. |
| Non-sampling error | Not applicable. |
| Timeliness and punctuality | |
| Timeliness | The deadlines for the publication of SBS data on national level are t+8 months for the preliminary data and t+11 months for the final data. In the Eurostat the preliminary and the final SBS data will be sent after t+10 months and t+18 months respectively, where t is the reference year. |
| Punctuality | The deadlines for publication are strictly followed. |
| Coherence and comparability | |
| Comparability - geographical | The methodology for calculating the SBS indicators is fully harmonized with the European legislation on SBS, which ensures comparability of data between Bulgaria and the other EU Member States, which have also fulfilled these requirements. |
| Comparability - over time | The comparability of the data is limited by the use of different classifications of economic activities (NACE.BG-2008 and NACE.BG-2003), if there is a difference in the scope of the activity. The data series are fully comparable for the period 2008 - the last reference year, and the period 2002-2007. |
| Coherence - cross domain | A study, conducted by Eurostat for the differences between logically related data from various surveys, have shown that the data differ in the range of 1%, which is quite normal and is due to different methodology or source. |
| Coherence - internal | Between interrelated SBS data series (a common module and data grouping by size-class of employment) there are no differences, but between the data of common module and the regional data the differences are methodological - the calculation of the first is based on the enterprise, while the second is based on the local unit.
|
| Cost and burden | |
NSI of Bulgaria is making extraordinary efforts to reduce the respondents' burden. An example is the signed agreement called 'Single Entry Point' between NSI and the National Revenue Agency for a single providing of the annual reports and using the data from both institutions. Developed by NSI on-line based information system 'Business Statistics' and ensured methodological and technical assistance to respondents during the reporting campaign are highly appreciated by respondents and help to reduce their workload. | |
| Data revision | |
| Data revision - policy | The National policy, as well as Eurostat's, allows the revision of already published data if there are serious reasons. Any revisions made in the national data are reflected in the aggregated data for the European Union. |
| Data revision - practice | The revised data replace the already published data as soon as possible after the revision is made. |
| Statistical processing | |
| Source data | The main data sources for calculating the SBS data are:
|
| Frequency of data collection | Yearly |
| Data collection | Exhaustively for all non-financial enterprises covered in the SBS survey. |
| Data validation | Data validation is made by additional logical input control and comparison between the output data and the results of the previous year and other surveys, carried out by NSI. |
| Data compilation | The survey is exhaustive and further data evaluation is not made. The SBS indicators are calculated on the enterprise (local unit) level and are aggregated in accordance with the requirements of the SBS regulations. |
| Adjustment | Not applicable. |
| Comment | |
Download in SDMX 2.1 file format: STRUCTURAL BUSINESS STATISTICS (SBS) - Annual data of non-financial enterprises
Metadata Structure Definition in SDMX 2.1: ESMS_MSD+BNSI+2.0+SDMX.2.1.xml
Download in SDMX 2.0 file format: STRUCTURAL BUSINESS STATISTICS (SBS) - Annual data of non-financial enterprises
Metadata Structure Definition in SDMX 2.0: ESMS_MSD+BNSI+2.0+SDMX.2.0.xml
ESS Standard for Quality Reports Structure (ESQRS)
| Contact | |
|---|---|
| Contact organisation | National Statistical Institute |
| Contact organisation unit | 'Annual Business Statistics' Department |
| Contact name | Maya Simeonova |
| Contact person function | Head of department |
| Contact mail address | 2, P. Volov Str.; 1038 Sofia, Bulgaria |
| Contact email address |
|
| Contact phone number | +359 2 9857 179 |
| Contact fax number | |
| Statistical presentation | |
| Data description | Starting reference year 2021 onwards SBS cover the economic activities of market producers within the NACE Rev. 2 Sections B to N, P to R and Divisions S95 and S96. The SBS survey of non-financial enterprises covers sections B to N (excluding K) and division S95, according to NACE.BG-2008, which are divided into four annexes - Industry (B, C, D and E), Construction (F), Distributive Trades (G) and Services (H, I, J, L, M, N and S95). For the period 2002 - 2007 the data were compiled by NACE.BG-2003 and were observed only sections C to I and section K. Since 2008 the data are compiled by NACE.BG-2008. The annual data of non-financial enterprises are aggregated by sections (the first sign of NACE.BG-2008 and NACE.BG-2003). The annual data, grouping by size class: the indicators are published on section level (the first sign of NACE.BG-2008 and NACE.BG-2003) and by size class of employment. Annual regional data: Three indicators are published on a regional level by sections (the first sign of NACE.BG-2008 and NACE.BG-2003) and by statistical regions (NUTS). The type and the content of the indicators and the aggregate levels are fully compliant with the European regulations on SBS, detailed in 'Legal acts and rules'. |
| Classification system |
|
| Sector coverage | Starting reference year 2021 onwards SBS cover the economic activities of market producers within the NACE Rev. 2 Sections B to N, P to R and Divisions S95 and S96. Non-financial enterprises, classified in sections B to N (excluding K) and division S95 by NACE.BG-2008 from 2008 onwards, sections C to I and section K by NACE.BG-2003 for the period 2002 - 2007. |
| Statistical concepts and definitions | The main SBS indicators are:
|
| Statistical unit | SBS data refer to statistical unit enterprise. |
| Statistical population | Starting reference year 2021 onwards SBS cover the economic activities of market producers within the NACE Rev. 2 Sections B to N, P to R and Divisions S95 and S96. The SBS survey is exhaustive and the statistical population includes all non-financial enterprises classified in sections B to N (excluding K) and division S95 by NACE.BG-2008 from 2008 onwards, sections C to I and section K by NACE.BG-2003 for the period 2002 - 2007. |
| Reference area | The data refer to the activities of non-financial enterprises carried out in the country. |
| Time coverage | Since 2008 (the data are calculated by NACE.BG-2008); 2002-2007 (the data are calculated by NACE.BG-2003). |
| Base period | Not applicable. |
| Statistical processing | |
| Source data | The main data sources for calculating the SBS data of the non-financial enterprises are:
|
| Frequency of data collection | Yearly |
| Data collection | Exhaustively for all non-financial enterprises covered in the SBS survey. |
| Data validation | Data validation is made by additional logical input control and comparison between the output data and the results of the previous year and other surveys, carried out by NSI. |
| Data compilation | The survey is exhaustive and further data evaluation is not made. The SBS indicators are calculated on the enterprise (local unit) level and are aggregated in accordance with the requirements of the SBS regulations. |
| Adjustment | Not applicable. |
| Quality management | |
| Quality assurance | This includes the improvement of the on-line based information system 'Business statistics', which ensures strict arithmetical and logical input control. The additional output control is made when are registered the big differences in the value of given indicator between two consecutive years or in comparison with the results of other statistical surveys in NSI - Short-term statistics, statistics Prodcom, Foreign trade, Labor force. |
| Quality assessment | This is made in accordance with the standard criteria for assessing the quality - relevance, accuracy and reliability, timeliness, comparability and coherence. |
| Relevance | |
| User needs | The main users of SBS data are:
|
| User satisfaction | There has been no study of user satisfaction, but no cases of outstanding requests for information are registered. |
| Completeness | For the period 2002-2008 the requirements of European regulations are met with a few exceptions, but since 2009 the compliance has been 100%. |
| Data completeness - rate | Full compliance - 100%. |
| Accuracy and reliability | |
| Overall accuracy | The statistical data have good accuracy and reliability. |
| Sampling error | The SBS survey is exhaustive and there are no sampling errors. |
| Sampling errors - indicators | Not applicable. |
| Non-sampling error | Not applicable. |
| Coverage error | Not applicable. |
| Over-coverage - rate | Not applicable. |
| Common units - proportion | 100% |
| Measurement error | Not applicable. |
| Non response error | Not applicable. |
| Unit non-response - rate | Not applicable. |
| Item non-response - rate | Not applicable. |
| Processing error | Not applicable. |
| Imputation - rate | Not applicable. |
| Model assumption error | Not applicable. |
| Seasonal adjustment | Not applicable. |
| Data revision - policy | The National policy, as well as Eurostat's, allows the revision of already published data if there are serious reasons. Any revisions made in the national data are reflected in the aggregated data for the European Union. |
| Data revision - practice | The revised data replace the already published data as soon as possible after the revision is made. |
| Data revision - average size | The data are not revised. |
| Timeliness and punctuality | |
| Timeliness | The deadlines for the publication of SBS data on national level are t+18 months for the final data. In the Eurostat the preliminary and the final SBS data will be sent after t+10 months and t+18 months respectively, where t is the reference year. |
| Time lag - first results | t+10 |
| Time lag - final results | t+18 |
| Punctuality | The deadlines for publication are strictly followed. |
| Punctuality - delivery and publication | Not applicable. |
| Coherence and comparability | |
100% | |
| Comparability - geographical | The methodology for calculating the SBS indicators is fully harmonized with the European legislation on SBS, which ensures comparability of data between Bulgaria and the other EU Member States, which have also fulfilled these requirements. |
| Asymmetry for mirror flows statistics - coefficient | Not applicable. |
| Comparability - over time | The comparability of the data is limited by the use of different classifications of economic activities (NACE.BG-2008 and NACE.BG-2003), if there is a difference in the scope of the activity. The data series are fully comparable for the period 2008 - the last reference year, and the period 2002-2007. |
| Length of comparable time series | 2008-2019 for the published data at national level |
| Coherence - cross domain | A study, conducted by Eurostat for the differences between logically related data from various surveys, have shown that the data differ in the range of 1%, which is quite normal and is due to different methodology or source.
|
| Coherence - sub annual and annual statistics | 100% methodological compliance of the variable 'Turnover'. |
| Coherence - National Accounts | Greatest extent possible. |
| Coherence - internal | Between interrelated SBS data series (a common module and data grouping by size-class of employment) there are no differences, but between the data of common module and the regional data the differences are methodological - the calculation of the first is based on the enterprise, while the second is based on the local unit. |
| Accessibility and clarity | |
| News release | - |
| Publications | - |
| On-line database | The SBS data are available to all users of the NSI website under the heading Business statistics - Annual business statistics - Structural Business Statistics - Non-financial Enterprises:
|
| Data tables - consultations | Consultations are provided mainly by the phone and there is no counting system. |
| Micro-data access | Not available. |
| Other | Information service on request, according to the Rules for dissemination of statistical products and services of NSI. |
| Metadata - consultations | Consultations are provided mainly by the phone and there is no counting system. |
| Documentation on methodology | Eurostat's methodological manual concerning SBS data, based on the European legislation on SBS and the harmonised national legislation in the same field. |
| Metadata completeness – rate | 100% |
| Quality documentation | National quality reports according to the SBS Regulations. |
| Cost and burden | |
NSI of Bulgaria is making extraordinary efforts to reduce the respondents' burden. An example is the signed agreement called 'Single Entry Point' between NSI and the National Revenue Agency for a single providing of the annual reports and using the data from both institutions. Developed by NSI on-line based information system 'Business Statistics' and ensured methodological and technical assistance to respondents during the reporting campaign are highly appreciated by respondents and help to reduce their workload. | |
| Confidentiality | |
| Confidentiality - policy | Regulation (EC) № 223/2009 of 11 March 2009 defines common criteria for protection of confidential data and methods for sending the information to and its use by Eurostat. The Law on Statistics ensures the protection of statistical confidentiality and the use of individual data of enterprises for statistical purposes only. |
| Confidentiality – data treatment | The individual (primary) data are confidential according to the Law on Statistics and European legislation. To ensure their protection and inability to be identified, the aggregated indicators are also defined as confidential when:
|
| Comment | |
Download in SDMX 2.1 file format: STRUCTURAL BUSINESS STATISTICS (SBS) - Annual data of non-financial enterprises
Metadata Structure Definition in SDMX 2.1: ESQRS_MSD+BNSI+2.0+SDMX.2.1.xml
Download in SDMX 2.0 file format: STRUCTURAL BUSINESS STATISTICS (SBS) - Annual data of non-financial enterprises
Metadata Structure Definition in SDMX 2.0: ESQRS_MSD+BNSI+2.0+SDMX.2.0.xml
Activity of Non Financial Enterprises for 2016 (preliminary data)
According to preliminary data 335 802 non-financial enterprises submitted their annual reports for 2016 at the National Statistical Institute. They generated 137 139 million BGN of production value and 48 566 million BGN of value added at factor cost, and employed 1 966 554 persons.
...Activity of Non Financial Enterprises for 2015 (preliminary data)
According to preliminary data 326 380 non-financial enterprises submitted their annual reports for 2015 at the National Statistical Institute. They generated 140 024 million BGN of production value, realised 44 765 million BGN of value added at factor cost and employed 1 921 578 persons.
...Activity of Non Financial Enterprises for 2014 (preliminary data)
According to preliminary data 319 744 non-financial enterprises submitted their annual reports for 2014 at the National Statistical Institute. They generated 129 258 million BGN of production value, realised 38 670 million BGN of value added at factor cost and employed 1 892 526 persons.
...Activity of Non-Financial Enterprises for 2013 (preliminary data)
According to preliminary data 315 587 non-financial enterprises submitted their annual reports for 2013 at the National Statistical Institute. The data show they made 124 457 million BGN of production value, generated 36 669 million BGN of value added at factor cost and employed 1 873 957 persons.
...Activity of Non Financial Enterprises for 2012 (preliminary data)
According to preliminary data at the National Statistical Institute 312 458 non-financial enterprises have submitted their annual reports for 2012 and have made 121 923 million Levs of production value, have generated 35 536 million Levs of value have added at factor cost and have employed 1 878 935 persons.
...Activity of Non Financial Enterprises for 2011 (preliminary data)
According to preliminary data 309 892 non-financial enterprises have submitted their annual reports for 2011 at the National Statistical Institute, employing 1 913 087 persons, generating 34 363 Million BGN of value added and making 13 933 Million BGN costs for gross investment in tangible goods.
...Activity of Non Financial Enterprises for 2010 (preliminary data)
According to the preliminary data 315 819 non-financial enterprises have submitted their annual reports for 2010 at the National Statistical Institute, employing 1 934 544 persons, generating 32 138 million BGN of value added and making 12 776 million BGN gross investments in tangible goods.
...Activity of Non Financial Enterprises, 2009
According to the preliminary data of the National Statistical Institute the Value added, generated by non financial enterprises, in 2009 was nearly 34 315 million BGN, where the highest share have the Industry and Transport, communication and services.
...Activity of Non Financial Enterprises, 2008
- <
- 1
- >
Statistical Reference Book 2024
Тhe National Statistical Institute presents to the users of statistical information the annual publication - Statistical Reference Book 2024 in English.
The Statistical Reference Book presents up-to-date information on the demographic processes as well as the economic, social and cultural development of the Republic of Bulgaria for the 2019 - 2023 period.
The publication presents data on main macroeconomic indicators of the national economy - gross domestic product, investments and finance; and economic acti...
Statistical Reference Book 2024 (Bulgarian version)
The National Statistical Institute presents to users of statistical information the annual publication - Statistical Reference Book 2024 in Bulgarian.
The Statistical Reference Book presents up-to-date information on the demographic processes as well as the economic, social and cultural development of the Republic of Bulgaria for the 2019 - 2023 period.
The publication presents data on main macroeconomic indicators of the national economy - gross domestic product, investments and finance; and economic activity groupings - industry, agriculture, forestry,...
Statistical Yearbook 2023
The National Statistical Institute (NSI) has the pleasure to present to the attention of national and foreign users of statistical information the 91-st edition of the ‘Statistical Yearbook of the Republic of Bulgaria’ in printed format.
It provides current statistical information about the demographic, economic and social development of the country for 2017 - 2022 in different territorial and classification aggregations and breakdowns.
According to the Law on Statistics, official source of information in the Republic of Bulgaria is the National Statistical Sys...
Statistical Reference Book 2023 (Bulgarian version)
The National Statistical Institute presents to users of statistical information the annual publication - Statistical Reference Book 2023 in Bulgarian.
The Statistical Reference Book presents topical information on the demographic processes as well as the economic, social and cultural development of the Republic of Bulgaria for the 2018 - 2022 period.
The publication presents data on main macroeconomic indicators of the national economy - gross domestic product, investments and finance; and economic activity groupings ...
Statistical Reference Book 2023

The National Statistical Institute presents to users of statistical information the annual publication - Statistical Reference Book 2023 in English.
The Statistical Reference Book presents topical information on the demographic processes as well as the economic, social and cultural development of the Republic of Bulgaria for the 2018 - 2022 period.
The publication presents data on main macroeconomic indicators of the national economy - gross domestic product, investments and finance; and economic activity groupings - industry, agriculture, fore...
Statistical Yearbook 2022
The National Statistical Institute (NSI) has the pleasure to present to the attention of national and foreign users of statistical information the 90th edition of the ‘Statistical Yearbook of the Republic of Bulgaria’ in printed format.
It provides current statistical information about the demographic, economic and social development of the country for 2016 - 2021 in different territorial and classification aggregations and breakdowns.
According to the Law on Statistics, official source of information in the Republic of Bulgaria is the National Statistical ...
Statistical Reference Book 2022
The National Statistical Institute presents to users of statistical information the annual publication - Statistical Reference Book 2022 in English.
The Statistical Reference Book presents topical information on the demographic processes as well as the economic, social and cultural development of the Republic of Bulgaria for the 2017 - 2021 period.
The publication presents data on main macroeconomic indicators of the national economy - gross domestic product, investments and finance; and economic activity groupings - industry, agriculture, ...
Statistical Reference Book 2022 (Bulgarian version)
The National Statistical Institute presents to users of statistical information the annual publication - Statistical Reference Book 2022 in Bulgarian.
The Statistical Reference Book presents topical information on the demographic processes as well as the economic, social and cultural development of the Republic of Bulgaria for the 2017 - 2021 period.
The publication presents data on main macroeconomic indicators of the national economy - gross domestic product, investments and finance; and economic activity groupings - industry, agriculture, fo...
Statistical Yearbook 2021
The National Statistical Institute (NSI) has the pleasure to present to the attention of national and foreign users of statistical information the 89th edition of the ‘Statistical Yearbook of the Republic of Bulgaria’ in printed and electronic format.
It provides current statistical information about the demographic, economic and social development of the country for 2015 - 2020 in different territorial and classification aggregations and breakdowns.
According to the Law on Statistics, official source of information in the Republic of Bulgaria is the ...
Statistical Reference Book 2021
The National Statistical Institute presents to users of statistical information the annual publication - Statistical Reference Book 2021 in English.
The Statistical Reference Book presents topical information on the demographic processes as well as the economic, social and cultural development of the Republic of Bulgaria for the 2016 - 2020 period.
The publication presents data on main macroeconomic indicators of the national economy - gross domestic product, investments and finance; and economic activity groupings - industry, agriculture, forestry, ...
Statistical Reference Book 2021 (Bulgarian version)

The National Statistical Institute presents to users of statistical information the annual publication - Statistical Reference Book 2021 in Bulgarian.
The Statistical Reference Book presents topical information on the demographic processes as well as the economic, social and cultural development of the Republic of Bulgaria for the 2016 - 2020 period.
The publication presents data on main macroeconomic indicators of the national economy - gross domestic product, investments and finance; and economic activity groupings - industry, agri...
Statistical Yearbook 2020
The National Statistical Institute (NSI) has the pleasure to present to the attention of national and foreign users of statistical information the 88th edition of the ‘Statistical Yearbook of the Republic of Bulgaria’ in printed and electronic format.
It provides current statistical information about the demographic, economic and social development of the country for 2014 - 2019 in different territorial and classification aggregations and breakdowns.
According to the Law on Statistics, official source of information in the Republic of Bulgaria is the ...
Statistical Yearbook 2012
The National Statistical Institute (NSI) has the pleasure to submit to the attention of national and foreign users of statistical information the 80th edition of the ‘Statistical Yearbook of the Republic of Bulgaria’ in printed and electronic format.
It provides current statistical information about the demographic, economic and social development of the country for the 2007 - 2011 period in different territorial and classification aggregations and breakdowns.
Accor...
Statistical Reference Book 2020
The National Statistical Institute presents to users of statistical information the annual publication - Statistical Reference Book 2020 in English.
The Statistical Reference Book presents topical information on the demographic processes as well as the economic, social and cultural development of the Republic of Bulgaria for the 2016 - 2019 period.
The publication presents data on main macroeconomic indicators of the national economy - gross domestic product, investments and finance; and economic activity groupings - industry, agriculture, forestry, ...
Statistical Reference Book 2020 (Bulgarian version)
The National Statistical Institute presents to users of statistical information the annual publication - Statistical Reference Book 2020 in Bulgarian.
The Statistical Reference Book presents topical information on the demographic processes as well as the economic, social and cultural development of the Republic of Bulgaria for the 2016 - 2019 period.
The publication presents data on main macroeconomic indicators of the national economy - gross domestic product, investments and finance; and economic activity groupings - industry, agriculture,...
Statistical Yearbook 2019
The National Statistical Institute (NSI) has the pleasure to present to the attention of national and foreign users of statistical information the 87th edition of the ‘Statistical Yearbook of the Republic of Bulgaria’ in printed and electronic format.
It provides current statistical information about the demographic, economic and social development of the country for 2013 - 2018 in different territorial and classification aggregations and breakdowns.
According to the Law on Statistics, official source of information in the Republic of Bulgaria is the ...
Statistical Yearbook 2018 in infographics
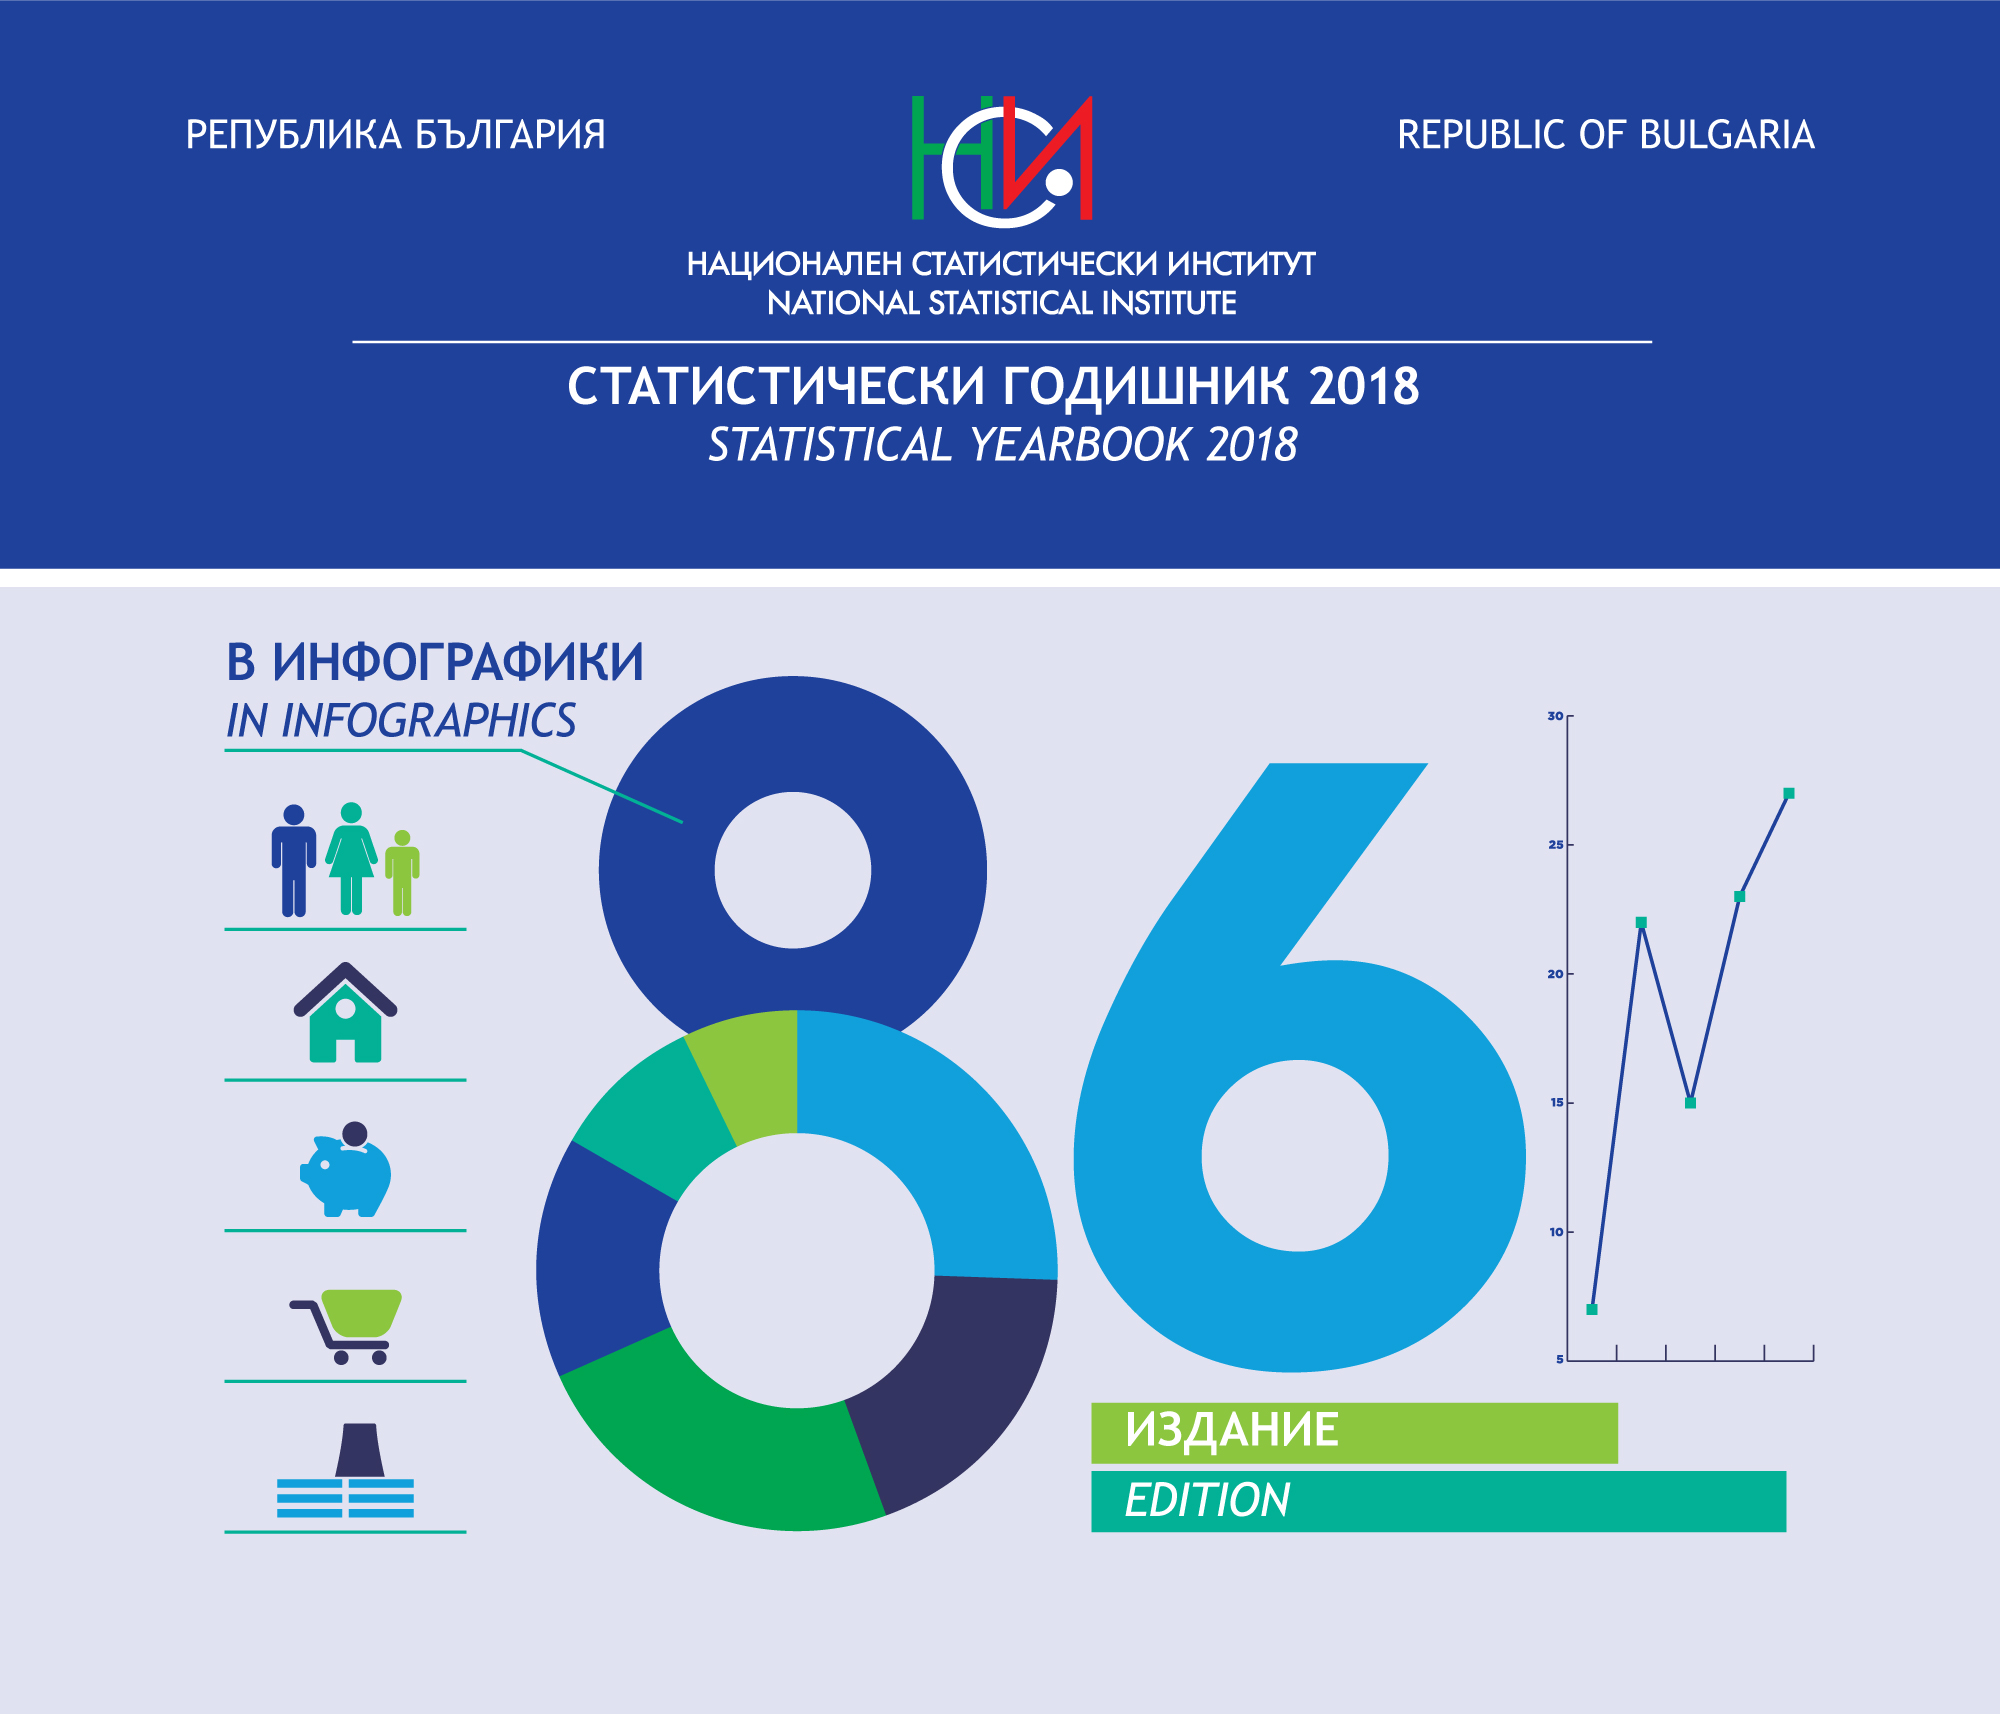
The National Statistical Institute presents to your attention the 86th edition of the Statistical Yearbook of the Republic of Bulgaria in infographics.
In 2018, for the first time, we presented the results of the statistical surveys through graphics, images and other visualization tools, which resulted in a positive response among a wide range of users. We believe that this modern way of presenting statistical information will trigger the interest in those who for the first time encounter the meaning of numbers revealing important aspects of socio-economic life.
...Statistical Reference Book 2019

The National Statistical Institute presents to users of statistical information the annual publication - Statistical Reference Book 2019 in English.
The Statistical Reference Book presents topical information on the demographic processes as well as the economic, social and cultural development of the Republic of Bulgaria for the 2015 - 2018 period.
The publication presents data on main macroeconomic indicators of the national economy - gross domestic product, investments and finance; and economic activity groupings - industry, agriculture, f...
Statistical Reference Book 2019 (Bulgarian version)

The National Statistical Institute presents to users of statistical information the annual publication - Statistical Reference Book 2019 in Bulgarian.
The Statistical Reference Book presents topical information on the demographic processes as well as the economic, social and cultural development of the Republic of Bulgaria for the 2015 - 2018 period.
The publication presents data on main macroeconomic indicators of the national economy - gross domestic product, investments and finance; and economic activity groupings - industry, agriculture, forestry, transp...
Statistical Yearbook 2018

The National Statistical Institute (NSI) has the pleasure to present to the attention of national and foreign users of statistical information the 86th edition of the ‘Statistical Yearbook of the Republic of Bulgaria’ in printed and electronic format.
It provides current statistical information about the demographic, economic and social development of the country for 2012 - 2017 in different territorial and classification aggregations and breakdowns.
According to the Law on Statistics, official source of information in the Republic of Bulgaria is the ...
Statistical Reference Book 2018
The National Statistical Institute presents to users of statistical information the annual publication - Statistical Reference Book 2018 in English.
The Statistical Reference Book presents topical information on the demographic processes as well as the economic, social and cultural development of the Republic of Bulgaria for the 2014 - 2017 period.
The publication presents data on main macroeconomic indicators of the national economy - gross domestic product, investments and finance; and economic activity groupings - industry, agriculture, f...
Statistical Yearbook 2017 in infographics
The National Statistical Institute of Bulgaria offers a different view of the statistical information included in the 85th edition of the Statistical Yearbook of the Republic of Bulgaria.
The publication is intended for a wider audience as statistical data are presented in a plain and easy understandable way.
The current state and changes in the socio-economic and cultural life in the country are presented not in the traditional way in tables and text, but through infographics - images, graphics and other visualization tools.
We belie...
Statistical Reference Book 2018 (Bulgarian version)
The National Statistical Institute presents to users of statistical information the annual publication - Statistical Reference Book 2018 in Bulgarian.
The Statistical Reference Book presents topical information on the demographic processes as well as the economic, social and cultural development of the Republic of Bulgaria for the 2014 - 2017 period.
The publication presents data on main macroeconomic indicators of the national economy - gross domestic product, investments and finance; and economic activity groupings - industry, agriculture, forestry, transp...
Statistical Yearbook 2017
The National Statistical Institute (NSI) has the pleasure to present to the attention of national and foreign users of statistical information the 84th edition of the ‘Statistical Yearbook of the Republic of Bulgaria’ in printed and electronic format.
It provides current statistical information about the demographic, economic and social development of the country for 2012 - 2016 in different territorial and classification aggregations and breakdowns.
According to the Law on Statistics, official source of information in the Republic of Bulgaria is the ...
Statistical Reference Book 2017
The National Statistical Institute presents to users of statistical information the annual publication - Statistical Reference Book 2017 in English.
The Statistical Reference Book presents topical information on the demographic processes as well as the economic, social and cultural development of the Republic of Bulgaria for the 2013 - 2016 period.
The publication presents data on main macroeconomic indicators of the national economy - gross domestic product, investments and finance; and economic activity groupings - industry, agriculture, f...
Statistical Reference Book 2017 (Bulgarian version)
The National Statistical Institute presents to users of statistical information the annual publication - Statistical Reference Book 2017 in Bulgarian.
The Statistical Reference Book presents topical information on the demographic processes as well as the economic, social and cultural development of the Republic of Bulgaria for the 2013 - 2016 period.
The publication presents data on main macroeconomic indicators of the national economy - gross domestic product, investments and finance; and economic activity groupings - industry, agriculture, forestry, transp...
Statistical Yearbook 2016
The National Statistical Institute (NSI) has the pleasure to present to the attention of national and foreign users of statistical information the 84th edition of the ‘Statistical Yearbook of the Republic of Bulgaria’ in printed and electronic format.
It provides current statistical information about the demographic, economic and social development of the country for 2011 - 2015 in different territorial and classification aggregations and breakdowns.
According to the Law on Statistics, official source of information in the Republic of Bulgaria is the ...
Statistical Reference Book 2016

The National Statistical Institute presents to users of statistical information the annual publication - Statistical Reference Book 2016 in English.
The Statistical Reference Book presents topical information on the demographic processes as well as the economic, social and cultural development of the Republic of Bulgaria for the 2012 - 2015 period.
The publication presents data on main macroeconomic indicators of the national economy - gross domestic product, investments and finance; and economic activity groupings - industry, agriculture, forestry, transpor...
Statistical Reference Book 2016 (Bulgarian version)

The National Statistical Institute presents to users of statistical information the annual publication - Statistical Reference Book 2016 in Bulgarian.
The Statistical Reference Book presents topical information on the demographic processes as well as the economic, social and cultural development of the Republic of Bulgaria for the 2012 - 2015 period.
The publication presents data on main macroeconomic indicators of the national economy - gross domestic product, investments and finance; and economic activity groupings - industry, agriculture, forestry, transp...
Statistical Yearbook 2015
The National Statistical Institute (NSI) has the pleasure to present to the attention of national and foreign users of statistical information the 83rd edition of the ‘Statistical Yearbook of the Republic of Bulgaria’ in printed and electronic format.
It provides current statistical information about the demographic, economic and social development of the country for 2010 - 2014 in different territorial and classification aggregations and breakdowns.
According to the Law on Statistics, official source of information in the Republic of Bulgaria is the ...
Statistical Reference Book 2015
The National Statistical Institute presents to users of statistical information the annual publication - Statistical Reference Book 2015 in English.
The Statistical Reference Book presents topical information on the demographic processes as well as the economic, social and cultural development of the Republic of Bulgaria for the 2010 - 2014 period.
The publication presents data on main macroeconomic indicators of the national economy - gross domestic product, investments and finance; and economic activity groupings - industry, agriculture, forestry, transport, c...
Statistical Reference Book 2015 (Bulgarian version)
The National Statistical Institute presents to users of statistical information the annual publication - Statistical Reference Book 2015 in Bulgarian.
The Statistical Reference Book presents topical information on the demographic processes as well as the economic, social and cultural development of the Republic of Bulgaria for the 2010 - 2014 period.
The publication presents data on main macroeconomic indicators of the national economy - gross domestic product, investments and finance; and economic activity groupings - industry, agriculture, forestry, transport,...
Statistical Yearbook 2014
The National Statistical Institute (NSI) has the pleasure to present to the attention of national and foreign users of statistical information the 82nd edition of the ‘Statistical Yearbook of the Republic of Bulgaria’ in printed and electronic format.
It provides current statistical information about the demographic, economic and social development of the country for 2009 - 2013 in different territorial and classification aggregations and breakdowns.
According to the Law on Statistics, official source of information in the Republic of Bulgaria is the Nati...
Statistical Reference Book 2014

The National Statistical Institute presents to users of statistical information the annual publication - Statistical Reference Book 2014 in English.
The Statistical Reference Book presents topical information on the demographic processes as well as the economic, social and cultural development of the Republic of Bulgaria for the 2009 - 2013 period.
The publication presents data on main macroeconomic indicators of the national economy - gross domestic product, investments and finance; and economic activity groupings - industry, agriculture, forestry, tran...
Statistical Reference Book 2014 (Bulgarian version)

The National Statistical Institute presents to users of statistical information the annual publication - Statistical Reference Book 2014 in Bulgarian.
The Statistical Reference Book presents topical information on the demographic processes as well as the economic, social and cultural development of the Republic of Bulgaria for the 2009 - 2013 period.
The publication presents data on main macroeconomic indicators of the national economy - gross domestic product, investments and finance; and economic activity groupings - industry, agriculture, forestry, tr...
Statistical Yearbook 2013

The National Statistical Institute (NSI) has the pleasure to present to the attention of national and foreign users of statistical information the 81st edition of the ‘Statistical Yearbook of the Republic of Bulgaria’ in printed and electronic format.
It provides current statistical information about the demographic, economic and social development of the country for 2008 - 2012 in different territorial and classification aggregations and breakdowns.
According to the Law on Statistics, official source of information in the Republic of Bulgaria is the Nati...
Statistical Reference Book 2013
The National Statistical Institute presents to users of statistical information the annual publication - Statistical Reference Book 2013 in English.
The Statistical Reference Book presents topical information on the demographic processes as well as the economic, social and cultural development of the Republic of Bulgaria for the 2008 - 2012 period.
The publication presents data on main macroeconomic indicators of the national economy - gross domestic product, investments and finance; and economic activity groupings - industry, agric...
Statistical Reference Book 2013 (Bulgarian version)

The National Statistical Institute presents to users of statistical information the annual publication - Statistical Reference Book 2013 in Bulgarian.
The Statistical Reference Book presents topical information on the demographic processes as well as the economic, social and cultural development of the Republic of Bulgaria for the 2008 - 2012 period.
The publication presents data on main macroeconomic indicators of the national economy - gross domestic product, investments and finance; and economic activity groupings - industry, agr...
Statistical Reference Book 2012

The National Statistical Institute presents to users of statistical information the annual publication - Statistical Reference Book 2012 in English.
The Statistical Reference Book represents topical information on the demographic processes as well as the economic, social and cultural development of the Republic of Bulgaria for the 2007 - 2011 period.
The publication presents data on main macroeconomic indicators of the national economy - gross domestic product, investments and finance; and economic activity groupings - industry, agr...
Statistical Reference Book 2012 (Bulgarian version)

The National Statistical Institute presents to users of statistical information the annual publication - Statistical Reference Book 2012 in Bulgarian.
The Statistical Reference Book presents topical information on the demographic processes as well as the economic, social and cultural development of the Republic of Bulgaria for the 2007 - 2011 period.
The publication presents data on main macroeconomic indicators of the national economy - gross domestic product, investments and finance; and economic activity groupings&...
Statistical Yearbook 2011
The National Statistical Institute (NSI) has the pleasure to submit to the attention of national and foreign users of statistical information the 79th edition of the ‘Statistical Yearbook of the Republic of Bulgaria’ in printed and electronic format.
It provides current statistical information about the demographic, economic and social development of the country for the 2005 - 2010 period in different territorial and classification aggregations and breakdowns.
According ...
Statistical Reference Book 2011
The National Statistical Institute presents to users of statistical information the annual publication - Statistical Reference Book 2011 in English. It is a concise form of the same issue in Bulgarian.
The Statistical Reference Book presents topical information on the demographic processes as well as the economic, social and cultural development of the Republic of Bulgaria for the 2006 - 2010 period.
The publication presents data on main macroeconomic indicators of the national economy - gross domestic product, investments...
Statistical Yearbook 2010
The National Statistical Institute (NSI) has the pleasure to submit to the attention of national and foreign users of statistical information the 78th edition of the ‘Statistical Yearbook of the Republic of Bulgaria’ in printed and electronic format.
It provides current statistical information about the demographic, economic and social development of the country for the 2004 - 2009 period in different territorial and classification aggregations and breakdowns.
Accor...
Statistical Yearbook 2009
The National Statistical Institute (NSI) has the pleasure to submit to the attention of national and foreign users of statistical information the 77th edition of the ‘Statistical Yearbook of the Republic of Bulgaria’ in printed and electronic format. The issue is published in 2010, which marks 130 years since the establishment of a statistical institution in Bulgaria and 100 years since publishing of the first ‘Statistical Yearbook of the Bulgarian Kingdom’ in 1910.
This issue has new design and layout. It provides current statistical information about ...
Statistical Reference Book 2010

The National Statistical Institute presents to users of statistical information the annual publication - Statistical Reference Book 2010 in English. It is a concise form of the same issue in Bulgarian.
The Statistical Reference Book presents topical information on the demographic processes as well as the economic, social and cultural development of the Republic of Bulgaria for the 2005 - 2009 period.
The publication presents data on main macroeconomic indicators of the national economy - gross domestic product, investments...
Statistical Reference Book 2009
The National Statistical Institute presents to users of statistical information the annual publication - Statistical Reference Book 2009 in English. It is a concise form of the same issue in Bulgarian.
The issue is with a new design and enrich contents. For the first time are included methodological and analytic notes towards all chapters. The information is illustrated with a rich graphic materials.
The Statistical Reference Book presents topical information on the demographic processes as well as the economic, social and cultural ...
Statistical Yearbook 2008
The National Statistical Institute has the pleasure to submit to the attention of national and foreign users of statistical information the 76th edition of the Statistical Yearbook of the Republic of Bulgaria 2008. It provides topical statistical information on the demographic, economic and social development of the country for the 2002 - 2007 period in different territorial and classification aggregations and breakdowns.
According to the Law on Statistics, official source of information in the Republic of Bulgaria is the National Statistical System, wh...
Statistical Reference Book of the Republic of Bulgaria 2008
The National Statistical Institute presents to users of statistical information one of its main publications - Statistical Reference Book of the Republic of Bulgaria 2008 in English. It is a concise form of the same issue in Bulgarian.
The Statistical Reference Book presents topical information on the demographic processes as well as the economic, social and cultural development of the Republic of Bulgaria for the 2004 - 2007 period.
The publication presents data on main macroeconomic indicators of the national economy - gross dom...


