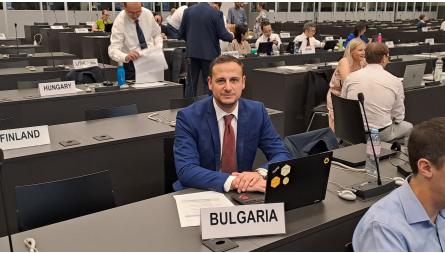
Teaching staff in vocational schools by sex and age

Time series : Edu_2.5.6_en.xls

TEACHING STAFF IN VOCATIONAL SCHOOLS AND COLLEGES BY SEX AND AGE1, 2024/2025 SCHOOL YEAR
(Number)
Age groups 2024/25
Total 12 978
Under 25 289
25 - 29 663
30 - 34 876
35 - 39 1 167
40 - 44 1 340
45 - 49 1 966
50 - 54 2 127
55 - 59 2 206
60 and over 2 344
Male 3 945
Under 25 137
25 - 29 310
30 - 34 380
35 - 39 416
40 - 44 402
45 - 49 431
50 - 54 459
55 - 59 529
60 and over 881
Female 9 033
Under 25 152
25 - 29 353
30 - 34 496
35 - 39 751
40 - 44 938
45 - 49 1 535
50 - 54 1 668
55 - 59 1 677
60 and over 1 463

1 Incl. teachers, directors and deputy directors with teacher work.
20.05.2025