Production and deliveries of oil and petroleum products
Time series : Energy-1.2.oil_products_en.xls
| Crude oil | 2024 | |||||
|---|---|---|---|---|---|---|
| I | II | III | IV | V | VI | |
| Production | .. | .. | .. | .. | .. | .. |
| Imports | 489 | 443 | 512 | 599 | 634 | 696 |
| Exports | - | - | - | - | - | - |
| Stock changes | 39 | -38 | -81 | -10 | 23 | 100 |
| Refinery intake | 449 | 481 | 593 | 608 | 611 | 596 |
| Refinery feedstocks | 2024 | |||||
|---|---|---|---|---|---|---|
| I | II | III | IV | V | VI | |
| Production | - | - | - | - | - | - |
| Imports | 77 | 6 | 13 | 6 | - | 6 |
| Exports | - | - | - | - | - | - |
| Stock changes | 45 | -42 | 5 | -1 | -8 | 1 |
| Refinery intake | 53 | 71 | 29 | 26 | 33 | 30 |
| Additives/oxygenates | 2024 | |||||
|---|---|---|---|---|---|---|
| I | II | III | IV | V | VI | |
| Production | - | - | - | - | - | - |
| Imports | 3 | 4 | 2 | 2 | 2 | 1 |
| Exports | - | - | - | - | - | - |
| Stock changes | 3 | 0 | 0 | 0 | 0 | -1 |
| Refinery intake | 2 | 4 | 2 | 2 | 2 | 2 |
| Other hydrocarbons | 2024 | |||||
|---|---|---|---|---|---|---|
| I | II | III | IV | V | VI | |
| Production | - | - | - | - | - | - |
| Imports | - | - | - | - | - | - |
| Exports | - | - | - | - | - | - |
| Stock changes | - | - | - | - | - | - |
| Refinery intake | 15 | 14 | 15 | 14 | 15 | 13 |
| Refinery gas | 2024 | |||||
|---|---|---|---|---|---|---|
| I | II | III | IV | V | VI | |
| Production | 35 | 36 | 39 | 38 | 39 | 35 |
| Imports | - | - | - | - | - | - |
| Exports | - | - | - | - | - | - |
| International marine bunkers | - | - | - | - | - | - |
| Stock changes | - | - | - | - | - | - |
| Gross inland deliveries | 8 | 9 | 9 | 8 | 9 | 8 |
| Liquefied petroleum gases | 2024 | |||||
|---|---|---|---|---|---|---|
| I | II | III | IV | V | VI | |
| Production | 4 | 5 | 8 | 11 | 11 | 12 |
| Imports | 43 | 39 | 31 | 32 | 28 | 24 |
| Exports | 4 | 5 | 3 | 4 | 3 | 1 |
| International marine bunkers | - | - | - | - | - | - |
| Stock changes | 4 | 3 | -4 | 3 | 0 | -3 |
| Gross inland deliveries | 39 | 36 | 39 | 36 | 36 | 39 |
| Naphtha | 2024 | |||||
|---|---|---|---|---|---|---|
| I | II | III | IV | V | VI | |
| Production | 32 | 44 | 55 | 59 | 56 | 56 |
| Imports | - | - | - | - | - | - |
| Exports | - | 60 | 60 | 30 | 60 | 30 |
| International marine bunkers | - | - | - | - | - | - |
| Stock changes | 30 | -18 | -5 | 25 | -9 | 26 |
| Gross inland deliveries | - | - | - | - | - | - |
| Motor gasoline2 | 2024 | |||||
|---|---|---|---|---|---|---|
| I | II | III | IV | V | VI | |
| Production | 142 | 140 | 144 | 162 | 146 | 143 |
| Imports | 20 | 17 | 11 | 18 | 17 | 18 |
| Exports | 96 | 99 | 143 | 142 | 89 | 163 |
| International marine bunkers | - | - | - | - | - | - |
| Stock changes | 22 | 12 | -21 | 1 | 33 | -57 |
| Gross inland deliveries | 52 | 50 | 36 | 43 | 49 | 58 |
| Kerosene type jet fuel | 2024 | |||||
|---|---|---|---|---|---|---|
| I | II | III | IV | V | VI | |
| Production | 18 | 18 | 18 | 20 | 23 | 26 |
| Imports | 1 | 1 | 4 | 3 | 0 | 1 |
| Exports | 3 | 1 | 5 | 6 | 4 | 4 |
| International marine bunkers | - | - | - | - | - | - |
| Stock changes | 0 | 4 | 0 | 0 | 2 | -2 |
| Gross inland deliveries | 16 | 13 | 16 | 16 | 18 | 25 |
| Transport diesel2 | 2024 | |||||
|---|---|---|---|---|---|---|
| I | II | III | IV | V | VI | |
| Production | 236 | 242 | 295 | 305 | 298 | 299 |
| Imports 1 | 40 | 32 | 20 | 27 | 11 | 28 |
| Exports 1 | 103 | 73 | 172 | 166 | 61 | 82 |
| International marine bunkers | 2 | 2 | 3 | 3 | 3 | 2 |
| Stock changes | -34 | 18 | -78 | -9 | 28 | 38 |
| Gross inland deliveries | 207 | 179 | 215 | 173 | 218 | 204 |
| Heating and other gasoil | 2024 | |||||
|---|---|---|---|---|---|---|
| I | II | III | IV | V | VI | |
| Production | 2 | 5 | 2 | 4 | 2 | 3 |
| Imports 1 | 29 | 24 | 17 | 23 | 22 | 17 |
| Exports 1 | - | 7 | - | - | - | - |
| International marine bunkers | 1 | 1 | 1 | 1 | 0 | 1 |
| Stock changes | 6 | 0 | -2 | 5 | -4 | -9 |
| Gross inland deliveries | 1 | 0 | 1 | 2 | 2 | 3 |
| Fuel oil - low sulphur (<1%) | 2024 | |||||
|---|---|---|---|---|---|---|
| I | II | III | IV | V | VI | |
| Production | 3 | 2 | 5 | 2 | 4 | 2 |
| Imports | 5 | 6 | 2 | 2 | 3 | 2 |
| Exports | 7 | 5 | 5 | 4 | 2 | 2 |
| International marine bunkers | 1 | 2 | 2 | 1 | 1 | 2 |
| Stock changes | -1 | 0 | -2 | -4 | 4 | -3 |
| Gross inland deliveries | 2 | 2 | 2 | 4 | 2 | 4 |
| Fuel oil - high sulphur (>1%) | 2024 | |||||
|---|---|---|---|---|---|---|
| I | II | III | IV | V | VI | |
| Production | 40 | 45 | 40 | 27 | 29 | 24 |
| Imports | - | - | - | - | - | - |
| Exports | 48 | 50 | 49 | 54 | 10 | 10 |
| International marine bunkers | - | - | - | - | - | - |
| Stock changes | -9 | -5 | -10 | -29 | 17 | 7 |
| Gross inland deliveries | - | - | 2 | 2 | 2 | 5 |
| Petroleum coke | 2024 | |||||
|---|---|---|---|---|---|---|
| I | II | III | IV | V | VI | |
| Production | 7 | 7 | 7 | 7 | 7 | 7 |
| Imports | 2 | 51 | 27 | 50 | 0 | 0 |
| Exports | 0 | 0 | 0 | - | - | - |
| International marine bunkers | - | - | - | - | - | - |
| Stock changes | -12 | 38 | -4 | 27 | -25 | -19 |
| Gross inland deliveries | 13 | 13 | 31 | 23 | 25 | 19 |
| Other petroleum products | 2024 | |||||
|---|---|---|---|---|---|---|
| I | II | III | IV | V | VI | |
| Production | 0 | 0 | 9 | 29 | 31 | 31 |
| Imports | 11 | 18 | 15 | 13 | 10 | 15 |
| Exports | 2 | 5 | 7 | 21 | 22 | 18 |
| International marine bunkers | 0 | 0 | 0 | 0 | 0 | 0 |
| Stock changes | 1 | 0 | 2 | -2 | -2 | 3 |
| Gross inland deliveries | 9 | 14 | 16 | 24 | 23 | 25 |
1 Data on the imported/exported quantities of Gas/diesel oil with CN codes: 27101943 + 27101946 + 27101947 + 27101948 + 27102011 + 27102016 + 27102019 are comparable with the sum of monthly data on imports/ exports + international marine bunkers of the two energy products: Transport diesel and Heating and other gasoil. |
||||||
| 2 Includes biofuel. | ||||||
| ".." confidential data | ||||||
| "-" figures not applicable | ||||||
| "0" less than half of the unit employed | ||||||
29.08.2024
| Contact | |
|---|---|
| Contact organisation | National Statistical Institute |
| Contact organisation unit | 'Environmental and Energy Accounts' Department |
| Contact name | Daniela Koleva - solid fuels Antonia Parvanova - oil and petroleum products Iveta Minkova - natural gas Tsvetelina Veselinova - electricity |
| Contact person function | Chief expert State expert State expert Chief expert |
| Contact mail address | 2, P.Volov Str., Sofia 1038, Bulgaria |
| Contact email address | |
| Contact phone number | +359 2 9857 590 +359 2 9857 589 +359 2 9857 191 +359 2 9857 476 |
| Contact fax number | |
| Metadata update | |
| Metadata last certified | 16 August 2023 |
| Metadata last posted | 16 August 2023 |
| Metadata last update | 16 August 2023 |
| Statistical presentation | |
| Data description | Monthly data on production, imports (incl.entries) by country of origin, exports (incl. exits) by country of destination, marine bunkers (for petroleum products only), stock change and deliveries of the following energy products: solid fuels, oil and petroleum products, natural gas and electricity. |
| Classification system | · Nomenclature of energy products as part of PRODPROM to 2007 · Nomenclature of energy products (PRODENERGY) since 01.01.2008 |
| Sector coverage | Economic activities, covered in data production are: Extraction of coal, oil and natural gas; Production of petroleum products; Production of BKB; Production of electricity; Transport via pipelines; Trade (imports/entries and exports/exits) of energy products. |
| Statistical concepts and definitions | Production, imports (incl. entries) by country of origin, exports (incl. exits) by country of destination, marine bunkers (for petroleum products only), stock change and deliveries of solid fuels, oil and petroleum products, natural gas and electricity. |
| Statistical unit | Statistical unit observed is enterprise. |
| Statistical population | Enterprises that produce, import and/or export, bunker, store and deliver energy products; operators, performing licensed activities of natural gas transmission and storage. |
| Reference area | For the territory of the Republic of Bulgaria. |
| Time coverage | Since January 2001. |
| Base period | Not applicable. |
| Unit of measure | |
Solid fuels - thousand tons Oil and petroleum products - thousand tons Natural gas - million m3 at 15C and TJ (Gross calorific value) Electricity - GWh, for the period 2001-2016 in thousand tons and TJ also | |
| Reference period | |
Calendar month. | |
| Institutional mandate | |
| Legal acts and other agreements | · Law on Statistics · Regulation (EC) No 1099/2008 of the European Parliament and of the Council of 22 October 2008 on energy statistics and its amendments (consolidated version): https://eur-lex.europa.eu/legal-content/EN/TXT/PDF/?uri=CELEX:02008R1099-20200105&from=EN |
| Data sharing | The data are provided to Eurostat and the International Energy Agency. |
| Confidentiality | |
| Confidentiality - policy | · Law on Statistics; · Regulation (EC) No 223/2009 on European statistics (recital 24 and Article 20(4)) of 11 March 2009 (OJ L 87, p. 164), stipulates the need to establish common principles and guidelines ensuring the confidentiality of data used for the production of European statistics and the access to those confidential data with due account for technical developments and the requirements of users in a democratic society: http://eur-lex.europa.eu/LexUriServ/LexUriServ.do?uri=OJ:L:2009:087:0164:0173:EN:PDF |
| Confidentiality - data treatment | Individual data are not published in accordance with article 25 of the Law on Statistics. Publishing of individual data can be performed only in accordance with article 26 of the same law. |
| Release policy | |
| Release calendar | Statistical information on the production and deliveries of energy products are published 60 days after the reference month. |
| Release calendar access | The calendar is available on the NSI website: https://www.nsi.bg/en/node/480 |
| User access | Statistical data are published on the NSI website, rubric 'Energy' in accordance with the Law on Statistics and the European Statistics Code of Practice respecting the professional independence and aimed at objectivity, transparency and equal treatment of all consumers. |
| Frequency of dissemination | |
Monthly | |
| Accessibility and clarity | |
| News release | Regular monthly press releases. |
| Publications | Not applicable. |
| On-line database | Detailed results are available to all users of the NSI website in section 'Environment and Energy', rubric 'Energy' - Production and deliveries of energy products: https://www.nsi.bg/en/node/5019, as wll as in Information system for online requests for statistical information 'INFOSTAT', section 'Environment and Energy', rubric 'Energy' - Production and deliveries of energy products: https://infostat.nsi.bg/infostat/pages/module.jsf?x_2=133 |
| Micro-data access | Not applicable. |
| Other | Information service upon request according to the Rules for dissemination of statistical products and services. |
| Documentation on methodology | Annex B - Monthly energy statistics of the Regulation (EC) No 1099/2008 of the European Parliament and of the Council of 22 October 2008 on energy statistics and its ammendments. |
| Quality documentation | Quality report for the data, prepared according to the requirements of the Regulation (EC) No 1099/2008 of the European Parliament and of the Council of 22 October 2008 on energy statistics - prepared on every 5 years. |
| Quality management | |
| Quality assurance | The data are validated and corrected by the NSI in case of inaccuracies found. |
| Quality assessment | Following the reporting of the data, Eurostat and the International Energy Agency carry out data validation procedure in which, if necessary, additional clarifications related to the reported data are sent, or corrections are made in case of inaccuracies. |
| Relevance | |
| User needs | Information is used for analytical, forecasting and management purposes by Ministries and other organizations, companies and citizens. |
| User satisfaction | No consumer satisfaction survey was conducted. |
| Completeness | Data completely cover the requirements of the Regulation (EC) No 1099/2008 of the European Parliament and of the Council of 22 October 2008 on energy statistics and its amendments in terms of the observed indicators and the range of energy products. |
| Accuracy and reliability | |
| Overall accuracy | |
| Sampling error | Not applicable. |
| Non-sampling error | Not applicable. |
| Timeliness and punctuality | |
| Timeliness | Respondents provide data on monthly surveys within 20 days after the reporting month. The data are reported in the following terms: - solid fuels - up to 60 days after the reporting month, - oil and oil products - preliminary data up to 25 days after the reporting month, final data - up to 55 days after the reporting month, - natural gas - preliminary data up to 30 days after the reporting month, final data - up to 55 days after the reporting month, - electricity - up to 60 days after the reporting month. |
| Punctuality | Data are published on the dates indicated in the Release Calendar presenting the results of the statistical surveys carried out by the NSI. |
| Coherence and comparability | |
Data are comparable with the data of the EU Member States for the whole observed period - from 2001. | |
| Comparability - geographical | Data are geographically comparable for the entire period for which they are available - from 2001. |
| Comparability - over time | Data are comparable in time for the entire period for which they are available - from 2001. |
| Coherence - cross domain | Data for the indicators Import (Entries), Exports (Exits) and Marine bunkering are consistent with the data of External Trade in Goods Statistics for the respective month, except in cases where methodological differences between the two areas exist. |
| Coherence - internal | Not applicable. |
| Cost and burden | |
Costs related to the collection and production of statistical data are announced annually in the National Statistical Program. No specific studies on the burden of the respondents. | |
| Data revision | |
| Data revision - policy | No established official policy for data revision. |
| Data revision - practice | Revision is made in case of change of the used classifications, methodologies, or in case of detection of incorrect data - omissions or inaccuracies in the data submitted by the respondents. |
| Statistical processing | |
| Source data | Statistical surveys: - Monthly report for solid fuels - Monthly report for oil and petroleum products - Monthly report for natural gas - Monthly report for electricity. |
| Frequency of data collection | Monthly |
| Data collection | Data collection is carried out with a questionnaires in Excel format, sent by e-mail. |
| Data validation | Questionnaires contain logical and arithmetical controls for preliminary control at the moment of the filling in the data by the respondents. Validation of the obtained data is performed in two stages: at regional level - in RSO and at national level - in NSI, and is expressed in comparison of data with the previous periods and other internal sources of information. |
| Data compilation | Aggregation of data at national level using Visual Basic. |
| Adjustment | Not applicable. |
| Comment | |
Up to 2019 data on production and imports of crude oil were confidential and were not published. From 2020 only the production is confidential. | |
Download in SDMX 2.1 file format: PRODUCTION AND DELIVERIES OF ENERGY PRODUCTS
Metadata Structure Definition in SDMX 2.1: ESMS_MSD+BNSI+2.0+SDMX.2.1.xml
Download in SDMX 2.0 file format: PRODUCTION AND DELIVERIES OF ENERGY PRODUCTS
Metadata Structure Definition in SDMX 2.0: ESMS_MSD+BNSI+2.0+SDMX.2.0.xml
ESS Standard for Quality Reports Structure (ESQRS)
| Contact | |
|---|---|
| Contact organisation | National Statistical Institute |
| Contact organisation unit | 'Environmental and Energy Accounts' Department |
| Contact name | Daniela Koleva - solid fuels Antonia Parvanova - oil and petroleum products Iveta Minkova - natural gas Tsvetelina Veselinova - electricity |
| Contact person function | Chief expert State expert State expert Chief expert |
| Contact mail address | 2, P.Volov Str., Sofia 1038, Bulgaria |
| Contact email address | |
| Contact phone number | +359 2 9857 590 +359 2 9857 589 +359 2 9857 191 +359 2 9857 476 |
| Contact fax number | |
| Statistical presentation | |
| Data description | Monthly data on production, imports (incl.entries) by country of origin, exports (incl. exits) by country of destination, marine bunkers (for petroleum products only), stock change and deliveries of the following energy products: solid fuels, oil and petroleum products, natural gas and electricity. |
| Classification system | · Nomenclature of energy products as part of PRODPROM to 2007 · Nomenclature of energy products (PRODENERGY) since 01.01.2008 |
| Sector coverage | Economic activities, covered in data production are: Extraction of coal, oil and natural gas; Production of petroleum products; Production of BKB; Production of electricity; Transport via pipelines; Trade (imports/entries and exports/exits) of energy products. |
| Statistical concepts and definitions | Production, imports (incl. entries) by country of origin, exports (incl. exits) by country of destination, marine bunkers (for petroleum products only), stock change and deliveries of solid fuels, oil and petroleum products, natural gas and electricity. |
| Statistical unit | Statistical unit observed is enterprise. |
| Statistical population | Enterprises that produce, import and/or export, bunker, store and deliver energy products; operators, performing licensed activities of natural gas transmission and storage. |
| Reference area | For the territory of the Republic of Bulgaria. |
| Time coverage | Since January 2001. |
| Base period | Not applicable. |
| Statistical processing | |
| Source data | Statistical surveys: - Monthly report for solid fuels - Monthly report for oil and petroleum products - Monthly report for natural gas - Monthly report for electricity. |
| Frequency of data collection | Monthly |
| Data collection | Data collection is carried out with a questionnaires in Excel format, sent by e-mail. |
| Data validation | Questionnaires contain logical and arithmetical controls for preliminary control at the moment of the filling in the data by the respondents. Validation of the obtained data is performed in two stages: at regional level - in RSO and at national level - in NSI, and is expressed in comparison of data with the previous periods and other internal sources of information. |
| Data compilation | Aggregation of data at national level using Visual Basic. |
| Adjustment | Not applicable. |
| Quality management | |
| Quality assurance | The data are validated and corrected by the NSI in case of inaccuracies found. |
| Quality assessment | Following the reporting of the data, Eurostat and the International Energy Agency carry out data validation procedure in which, if necessary, additional clarifications related to the reported data are sent, or corrections are made in case of inaccuracies. |
| Relevance | |
| User needs | Information is used for analytical, forecasting and management purposes by Ministries and other organizations, companies and citizens. |
| User satisfaction | No consumer satisfaction survey was conducted. |
| Completeness | Data completely cover the requirements of the Regulation (EC) No 1099/2008 of the European Parliament and of the Council of 22 October 2008 on energy statistics and its amendments in terms of the observed indicators and the range of energy products. |
| Data completeness - rate | Number of data cells provided is equal to the number of required data cells, according to the specifics of each energy product. |
| Accuracy and reliability | |
| Overall accuracy | |
| Sampling error | Not applicable. |
| Sampling errors - indicators | Not applicable. |
| Non-sampling error | Not applicable. |
| Coverage error | Isolated cases of companies that have ceased or changed their activities, having a negligible impact on aggregated data at the national level. |
| Over-coverage - rate | No over-coverage. |
| Common units - proportion | Very high share of the common units, as the respondents for indicators Imports (Entries) / Exports (Exits) from the monthly surveys are determined on the basis of administrative data. |
| Measurement error | Isolated cases of incorrect or missing data. |
| Non response error | No non-response errors. |
| Unit non-response - rate | Not applicable. |
| Item non-response - rate | Not applicable. |
| Processing error | No processing errors. |
| Imputation - rate | Not applicable. |
| Model assumption error | Not applicable. |
| Seasonal adjustment | Not applicable. |
| Data revision - policy | No established official policy for data revision. |
| Data revision - practice | Revision is made in case of change of the used classifications, methodologies, or in case of detection of incorrect data - omissions or inaccuracies in the data submitted by the respondents. |
| Data revision - average size | Not currently calculated. |
| Timeliness and punctuality | |
| Timeliness | Respondents provide data on monthly surveys within 20 days after the reporting month. The data are reported in the following terms: - solid fuels - up to 60 days after the reporting month, - oil and oil products - preliminary data up to 25 days after the reporting month, final data - up to 55 days after the reporting month, - natural gas - preliminary data up to 30 days after the reporting month, final data - up to 55 days after the reporting month, - electricity - up to 60 days after the reporting month. |
| Time lag - first results | Not applicable. |
| Time lag - final results | Data are published on the 60th day after the reporting month. |
| Punctuality | Data are published on the dates indicated in the Release Calendar presenting the results of the statistical surveys carried out by the NSI. |
| Punctuality - delivery and publication | Data are submitted in time according to the Release Calendar presenting the results of the statistical surveys carried out by the NSI. |
| Coherence and comparability | |
Data are comparable with the data of the EU Member States for the whole observed period - from 2001. | |
| Comparability - geographical | Data are geographically comparable for the entire period for which they are available - from 2001. |
| Asymmetry for mirror flows statistics - coefficient | Not applicable. |
| Comparability - over time | Data are comparable in time for the entire period for which they are available - from 2001. |
| Length of comparable time series | Time series with no breaks for the period from 2001 to the last reporting month. |
| Coherence - cross domain | Data for the indicators Import (Entries), Exports (Exits) and Marine bunkering are consistent with the data of External Trade in Goods Statistics for the respective month, except in cases where methodological differences between the two areas exist. |
| Coherence - sub annual and annual statistics | Not applicable. |
| Coherence - National Accounts | Not applicable. |
| Coherence - internal | Not applicable. |
| Accessibility and clarity | |
| News release | Regular monthly press releases. |
| Publications | Not applicable. |
| On-line database | Detailed results are available to all users of the NSI website in section 'Environment and Energy', rubric 'Energy' - Production and deliveries of energy products: https://www.nsi.bg/en/node/5019, as wll as in Information system for online requests for statistical information 'INFOSTAT', section 'Environment and Energy', rubric 'Energy' - Production and deliveries of energy products: https://infostat.nsi.bg/infostat/pages/module.jsf?x_2=133 |
| Data tables - consultations | Not applicable. |
| Micro-data access | Not applicable. |
| Other | Information service upon request according to the Rules for dissemination of statistical products and services. |
| Metadata - consultations | Not applicable. |
| Documentation on methodology | Annex B - Monthly energy statistics of the Regulation (EC) No 1099/2008 of the European Parliament and of the Council of 22 October 2008 on energy statistics and its ammendments. |
| Metadata completeness – rate | The metadata elements provided match the total number of metadata elements applied. |
| Quality documentation | Quality report for the data, prepared according to the requirements of the Regulation (EC) No 1099/2008 of the European Parliament and of the Council of 22 October 2008 on energy statistics - prepared on every 5 years. |
| Cost and burden | |
Costs related to the collection and production of statistical data are announced annually in the National Statistical Program. No specific studies on the burden of the respondents. | |
| Confidentiality | |
| Confidentiality - policy | · Law on Statistics; · Regulation (EC) No 223/2009 on European statistics (recital 24 and Article 20(4)) of 11 March 2009 (OJ L 87, p. 164), stipulates the need to establish common principles and guidelines ensuring the confidentiality of data used for the production of European statistics and the access to those confidential data with due account for technical developments and the requirements of users in a democratic society: http://eur-lex.europa.eu/LexUriServ/LexUriServ.do?uri=OJ:L:2009:087:0164:0173:EN:PDF |
| Confidentiality – data treatment | Individual data are not published in accordance with article 25 of the Law on Statistics. Publishing of individual data can be performed only in accordance with article 26 of the same law. |
| Comment | |
Up to 2019 data on production and imports of crude oil were confidential and were not published. From 2020 only the production is confidential. | |
Download in SDMX 2.1 file format: PRODUCTION AND DELIVERIES OF ENERGY PRODUCTS
Metadata Structure Definition in SDMX 2.1: ESQRS_MSD+BNSI+2.0+SDMX.2.1.xml
Download in SDMX 2.0 file format: PRODUCTION AND DELIVERIES OF ENERGY PRODUCTS
Metadata Structure Definition in SDMX 2.0: ESQRS_MSD+BNSI+2.0+SDMX.2.0.xml
Production and Deliveries of Energy Products, June 2024
In June 2024, compared to May 2024, an increase is reported in the production of: solid fuels - by 27.9%, liquefied petroleum gases - by 9.1%, and transport diesel - by 0.3%. A decrease is reported in the production of: electricity - by 3.9%, and motor gasoline - by 2.1%. There is no change in the production of natural gas.
Compared to June 2023, an increase is reported in the production of: liquefied petroleum gases - by 50.0%, transport diesel - by 11.6%, and motor gasoline - by 6.7%. A decrease is reported in the production of: solid fuel...
Production and Deliveries of Energy Products, May 2024
In May 2024, compared to April 2024, for the production of energy products no increase is observed in any of the products. A decrease is reported in the production of: solid fuels - by 36.6%, electricity - by 19.8%, motor gasoline - by 9.9%, and transport diesel - by 2.3%. There is no change in the production of natural gas and liquefied petroleum gases.
Compared to May 2023, an increase is reported in the production of: liquefied petroleum gases - by 83.3%, transport diesel - by 19.7%, and electricity - by 1.8%. A decrease is reported in the pro...
Production and Deliveries of Energy Products, April 2024
In April 2024, compared to March 2024, an increase is reported in the production of: liquefied petroleum gases - by 37.5%, motor gasoline - by 12.5%, and transport diesel - by 3.4%. A decrease is reported for the production of: solid fuels - by 41.1%, and electricity - by 3.4%. There is no change in the production of natural gas.
Compared to April 2023, the production of liquefied petroleum gases, motor gasoline and transport diesel increased significantly, due to unusually low production during the same month of the previous year, and it currently reaches its usual levels. ...
Production and Deliveries of Energy Products, March 2024
In March 2024, compared to February 2024, an increase is reported in the production of: liquefied petroleum gases - by 60.0%, transport diesel - by 21.9%, solid fuels - by 16.9%, electricity - by 3.8%, and motor gasoline - by 2.9%. A decrease is not reported for the production of any of the products. There is no change in the production of natural gas.
Compared to the same month of the previous year, an increase is reported for the production of: liquefied petroleum gases - by 60.0%, transport diesel - by 54.5%, and motor gasoline - by 30.9%...
Production and Deliveries of Energy Products, February 2024
In February 2024, compared to January 2024, an increase is reported for the production of: liquefied petroleum gases - by 25.0%, and transport diesel - by 2.5%. A decrease is reported for the production of: solid fuels - by 36.5%, electricity - by 14.4%, and motor gasoline - by 4.1%. There is no change in the production of natural gas.
Compared to the same month of the previous year, an increase is reported for the production of: motor gasoline - by 20.7%, and transport diesel - by 6.6%. A decrease is reported for the production of: solid fuels&n...
Production and Deliveries of Energy Products, January 2024
In January 2024, compared to December 2023, an increase is reported for the production of: liquefied petroleum gases - by 33.3%, and motor gasoline - by 6.6%. A decrease is reported for the production of: solid fuels - by 27.4%, transport diesel - by 14.5%, and electricity - by 1.3%. There is no change in the production of natural gas.
Compared to the same month of the previous year, an increase is not reported for the production of any of the products. A decrease is reported for the production of: solid fuels - by 48.8%, liquefied petroleum gases&nbs...
Production and Deliveries of Energy Products, December 2023
In December 2023, compared to November 2023, an increase is reported for the production of: solid fuels - by 22.1%, electricity - by 21.2%, and transport diesel - by 6.2%. A decrease is reported for the production of: liquefied petroleum gases - by 25.0%, and motor gasoline - by 9.3%. There is no change for the production of natural gas.
Compared to the same month of the previous year, an increase is reported for the production of transport diesel - by 12.2%. A decrease is reported for the production of: liquefied petroleum gases - by 50.0%, solid fuels - by 34.6%, electricity - b...
Production and Deliveries of Energy Products, November 2023
In November 2023, compared to October 2023, an increase is reported for the production of electricity - by 11.6%. A decrease is reported for the production of: liquefied petroleum gases - by 42.9%, motor gasoline - by 10.7%, solid fuels - by 10.6%, and transport diesel - by 7.1%. There is no change for the production of natural gas.
Compared to the same month of the previous year, an increase is not reported for the production of any of the products. A decrease is reported for the production of: liquefied petroleum gases - by 50.0%, solid fuels -...
Production and Deliveries of Energy Products, October 2023
In October 2023, compared to September 2023, an increase is reported for the production of: solid fuels - by 41.3%, motor gasoline - by 12.7%, and transport diesel - by 7.7%. A decrease is reported for the production of: liquefied petroleum gases - by 12.5%, and electricity - by 11.5%. There is no change for the production of natural gas.
Compared to the same month of the previous year, an increase is not reported for the production of any of the products. A decrease is reported for the production of: solid fuels - by 30.7%, transport diesel - by...
Production and Deliveries of Energy Products, September 2023
In September 2023, compared to August 2023, an increase is reported for the production of solid fuels - by 6.3%. A decrease is reported for the production of: motor gasoline - by 12.3%, transport diesel - by 10.0%, and electricity - by 3.7%. There is no change for the production of natural gas and liquefied petroleum gases.
Compared to the same month of the previous year, an increase is reported for the production of motor gasoline - by 50.0%. A decrease is reported for the production of: solid fuels - by 51.7%, electricity - by 15.1%, and transp...
Production and Deliveries of Energy Products, August 2023
In August 2023, compared to July 2023, an increase is reported for the production of: liquefied petroleum gases - by 33.3%, and motor gasoline - by 1.2%. A decrease is reported for the production of: solid fuels - by 3.8%, electricity - by 2.6%, and transport diesel - by 2.0%. No change for the production of natural gas.
Compared to the same month of the previous year, an increase is reported for the production of motor gasoline - by 6.2%. A decrease is reported for the production of: solid fuels - by 46.7%, liquefied petroleum gases - by 27...
Production and Deliveries of Energy Products, July 2023
In July 2023, compared to June 2023, an increase is reported for the production of: solid fuels - by 71.4%, motor gasoline - by 26.1%, electricity - by 13.2%, and transport diesel - by 10.1%. A decrease is reported for the production of liquefied petroleum gases - by 25.0%. No change for the production of natural gas.
Compared to the same month of the previous year, an increase is reported for the production of motor gasoline - by 4.3%. A decrease is reported for the production of: solid fuels - by 50.7%, liquefied petroleum gases - by 40.0%...
Production and Deliveries of Energy Products, June 2023
In June 2023, compared to May 2023, an increase is reported for the production of: liquefied petroleum gases - by 33.3%, electricity - by 17.7%, and transport diesel - by 7.6%. A decrease is reported for the production of: solid fuels - by 24.2%, and motor gasoline - by 10.1%. No change for the production of natural gas.
Compared to the same month of the previous year, a decrease is reported for the production of: solid fuels - by 66.6%, natural gas - by 50.0%, electricity - by 26.5%, motor gasoline - by 14.6%, transport diesel - by 11.8%, and liquefied petroleum gases - by ...
Production and Deliveries of Energy Products, May 2023
In May 2023, compared to April 2023, an increase is reported for the production of: liquefied petroleum gases - by 100.0%, transport diesel - by 41.5%. The production of motor gasoline significantly increase, due to unusually low production in April 2023, as currently reaches its usual levels. A decrease is reported for the production of: solid fuels - by 27.5%, electricity - by 17.8%. No change for the production of natural gas.
Compared to the same month of the previous year, a decrease is reported for the production of: solid fuels - by 62.5%, nat...
Production and Deliveries of Energy Products, April 2023
In April 2023, compared to March 2023, for the production of energy products, no increase is observed for any of the products. A decrease is reported for the production of: unleaded motor gasoline - by 59.1%, liquefied petroleum gases - by 40.0%, solid fuels - by 27.1%, electricity - by 17.3%, and transport diesel by - 7.9%. No change for the production of natural gas.
Compared to the same month of the previous year, a decrease is reported for the production of: unleaded motor gasoline - by 67.4%, liquefied petroleum gases - by 57.1%, natural gas - by 50.0%, solid fuels - by...
Production and Deliveries of Energy Products, March 2023
In March 2023, compared to February 2023, for the production of energy products, no increase is observed for any of the products. A decrease is reported for the production of: solid fuels - by 28.8%, transport diesel by - 15.9%, electricity - by 9.9%, and unleaded motor gasoline - by 5.2%. No change for the production of liquefied petroleum gases and natural gas.
In March 2023, compared to the same month of the previous year, for the production of energy products, no increase is observed for any of the products. A decrease is reported for the production of: natural gas - by 50.0%,...
Production and Deliveries of Energy Products, February 2023
In February 2023, compared to January 2023, for the production of energy products, no increase is observed for any of the products. A decrease is reported for the production of: unleaded motor gasoline - by 29.7%, liquefied petroleum gases - by 28.6%, transport diesel by - 28.6%, solid fuels - by 8.7%, and electricity - by 7.3%. No change for the production of natural gas.
In February 2023, compared to the same month of the previous year, an increase is reported only for the production of liquefied petroleum gases - by 66.7%. A decrease is reported for the production of: nat...
Production and Deliveries of Energy Products, January 2023
In January 2023, compared to December 2022, an increase is reported for the production of: transport diesel by - 29.3%, liquefied petroleum gases - by 16.7%, unleaded motor gasoline - by 5.8%, and electricity - by 1.3%. A decrease is reported only for the production of solid fuels - by 7.2%. No change for the production of natural gas.
In January 2023, compared to the same month of the previous year, an increase is reported for the production of: liquefied petroleum gases - by 75.0%, transport diesel - by 23.3%, and unleaded motor gasoline&...
Production and Deliveries of Energy Products, December 2022
In December 2022, compared to November 2022, an increase is reported for the production of: solid fuels - by 5.8%, and electricity - by 4.5%. A decrease is reported for the production of: liquefied petroleum gases - by 25.0%, transport diesel - by 20.4%, and unleaded motor gasoline - by 3.1%. No change for the production of natural gas.
In December 2022, compared to the same month of the previous year, during which planned repairs of production installations were carried out, the production of liquefied petroleum gases and unleaded motor gasoline increased...
Production and Deliveries of Energy Products, November 2022
In November 2022, compared to October 2022, an increase is reported for the production of: electricity - by 31.1%, and solid fuels - by 9.3%. A decrease is reported for the production of: unleaded motor gasoline - by 13.0%, and transport diesel - by 6.4%. No change for the production of liquefied petroleum gases and natural gas.
In November 2022, compared to the same month of the previous year, during which planned repairs of production installations were carried out, the production of liquefied petroleum gases, unleaded motor gasoline and transport diesel increased...
Production and Deliveries of Energy Products, October 2022
In October 2022, compared to September 2022, an increase is reported for the production of: unleaded motor gasoline - by 85.0% and transport diesel - by 18.7%. A decrease is reported for the production of: electricity - by 13.7%, and solid fuels - by 1.5%. No change for the production of liquefied petroleum gases and natural gas.
In October 2022, compared to the same month of the previous year, during which planned repair of production installations was carried out, the production of liquefied petroleum gases, unleaded motor gasoline and transport diesel increa...
Production and Deliveries of Energy Products, September 2022
In September 2022, compared to August 2022, an increase is reported for the production of: solid fuels - by 17.4%. A decrease is reported for the production of: unleaded motor gasoline - by 37.9%, liquefied petroleum gases - by 27.3%, transport diesel by - 14.5%, electricity - by 10.1%. No change for the production of natural gas.
In September 2022, compared to the same month of the previous year, an increase is reported for the production of: transport diesel - by 31.8%, solid fuels - by 1.3%. A decrease is reported for the production of: natural gas - by 50.0%, lique...
Production and Deliveries of Energy Products, August 2022
In August 2022, compared to July 2022, an increase is reported for the production of liquefied petroleum gases by 10.0%. A decrease is reported for the production of: solid fuels - by 11.0%, electricity - by 1.8%, and unleaded motor gasoline - by 0.6%. No change in the production of transport diesel and natural gas.
In August 2022, compared to the same month of the previous year, an increase is reported for the production of: transport diesel - by 34.9%, unleaded motor gasoline - by 29.8%, and electricity - by 6.8%. A decrease is reported for the production of: natural gas - by 50...
Production and Deliveries of Energy Products, July 2022
In July 2022, compared to June 2022, an increase is reported for the production of: solid fuels - by 16.1%, liquefied petroleum gases - by 11.1%, transport diesel - by 6.9%, electricity - by 4.2% and unleaded motor gasoline - by 3.2%. A decrease is reported only for the production of natural gas - by 50.0%.
In July 2022, compared to the same month of the previous year, an increase is reported for the production of: transport diesel - by 54.0%, solid fuels - by 39.6%, unleaded motor gasoline - by 33.9%, liquefied petroleum gases - by 25.0% and electricity - by 9.6%. A decrease is r...
Production and Deliveries of Energy Products, June 2022
In June 2022, compared to May 2022, an increase is reported for the production of: electricity - by 11.2% and transport diesel - by 2.4%. A decrease is reported for the production of: solid fuels - by 14.8% and unleaded motor gasoline - by 1.9%. No change for the production of liquefied petroleum gases and natural gas.
In June 2022, compared to the same month of the previous year, an increase is reported for the production of: solid fuels - by 137.7%, liquefied petroleum gases - by 50.0%, unleaded motor gasoline - by 40.2%, transport diesel - by 36.3% and electricity - by 25...
Production and Deliveries of Energy Products, May 2022
In May 2022, compared to April 2022, an increase is reported for the production of solid fuels - by 7.8%, liquefied petroleum gases - by 28.6%, unleaded motor gasoline - by 15.9% and transport diesel - by 25.3%. A decrease is reported for the production of electricity - by 12.0%. No change for the production of natural gas.
In May 2022, compared to April 2022, an increase is reported for the deliveries of solid fuels - by 7.8%, unleaded motor gasoline - by 41.9% and transport diesel - by 4.2%. A decrease is reported for the deliveries of natural gas - by 1.0% and electricity - by ...
Production and Deliveries of Energy Products, April 2022
In April 2022, compared to March 2022, a decrease is reported for the production of solid fuels - by 27.8%, unleaded motor gasoline - by 14.8%, transport diesel - by 19.1% and electricity - by 19.9%. No change in the production of liquefied petroleum gases and natural gas.
In April 2022, compared to March 2022, an increase is reported for the deliveries of liquefied petroleum gases - by 6.3%. A decrease is reported for the deliveries of solid fuels - by 27.8%, unleaded motor gasoline - by 41.5%, transport diesel - by 26.4%, natural gas - by 42.3% and electricity - by 22.6%.
...Production and Deliveries of Energy Products, March 2022
In March 2022, compared to February 2022, an increase is reported for the production of solid fuels - by 8.7%, liquefied petroleum gases - by 133.3%, unleaded motor gasoline - by 31.7%, transport diesel - by 29.1% and electricity - by 14.7%. No change in the production of natural gas.
In March 2022, compared to February 2022, an increase is reported for the deliveries of solid fuels - by 8.5%, liquefied petroleum gases - by 10.3%, unleaded motor gasoline - by 55.9%, transport diesel - by 47.5%, natural gas - by 10.1% and electricit...
Production and Deliveries of Energy Products, February 2022
In February 2022, compared to January 2022, a decrease is reported for the production of solid fuels - by 8.7%, liquefied petroleum gases - by 25.0%, unleaded motor gasoline - by 15.8%, transport diesel - by 12.0% and electricity - by 13.2%. No change in the production of natural gas.
In February 2022, compared to January 2022, a decrease is reported for the deliveries of solid fuels - by 8.4%, liquefied petroleum gases - by 9.4%, unleaded motor gasoline - by 17.1%, transport diesel - by 1.7%, natural gas - by 17.8% and electricity - by 15.0%.
...Production and Deliveries of Energy Products, January 2022
In January 2022, compared to December 2021, an increase is reported for the production of solid fuels - by 11.5% and electricity - by 3.1%. Production of petroleum products is recovered to its usual levels after the planned repairs of production facilities carried out in the previous months: liquefied petroleum gases - 4 thousand tonnes, unleaded motor gasoline - 146 thousand tonnes and transport diesel - 258 thousand tonnes. No change in the production of natural gas.
In January 2022, compared to December 2021, an increase is reported for the deliveries of solid fuels - by 10.2%,...
Production and Deliveries of Energy Products, December 2021
In December 2021, compared to November 2021, an increase is reported for the production of electricity - by 13.5% to 5 013 GWh. Production of petroleum products is gradually recovering after the planned repairs of production facilities carried out in the previous months, but still keeps its low levels compared to the usual ones: liquefied petroleum gases - 1 thousand tonnes, unleaded motor gasoline - 51 thousand tonnes and transport diesel - 172 thousand tonnes. No change in the production of solid fuels and natural gas (Annex, Table 1).
In December 2021, compared to November 2021...
Production and Deliveries of Energy Products, November 2021
In November 2021, compared to October 2021, an increase is reported for the production of electricity - by 12.4%. At the same time a decrease is reported for the production of solid fuels - by 6.5%. Production of petroleum products keeps its low levels due to scheduled repairs of production installations continuing in November. While unleaded motor gasoline and liquefied petroleum gases has no change compared to the levels from previos month, a decrease is observed for the production of transport diesel by 34.1%. No change for the production of natural gas.
In Nove...
Production and Deliveries of Energy Products, October 2021
In October 2021, compared to September 2021, an increase is reported for the production of solid fuels - by 21.7%. There is a significant decrease in the production of petroleum products due to scheduled repairs of production installations during the month: liquefied petroleum gases - by 100%, unleaded motor gasoline - by 96.3% and transport diesel - by 79.1%. At the same time a decrease is also reported for the production of electricity - by 2.0%. No change for the production of natural gas.
In October 2021, compared to September 2021, an increase is reported for the deliver...
Production and Deliveries of Energy Products, September 2021
In September 2021 compared to August 2021 an increase is reported for the production of: solid fuels - by 10.6% and electricity - by 3.9%. At the same time a decrease is reported for the deliveries of: liquefied petroleum gases - by 18.2%, unleaded motor gasoline - by 13.7% and transport diesel - by 12.8%. No change for the production of natural gas.
In September 2021 compared to August 2021 an increase is reported for the deliveries of: solid fuels - by 8.7% and natural gas - by 5.1%. At the same time a decrease is reported for the deliveries of: liquefied petroleum gases - by 14...
Production and Deliveries of Energy Products, August 2021
In August 2021 compared to July 2021 an increase is reported for the production of: solid fuels - by 30.1%, liquefied petroleum gases - by 37.5%, unleaded motor gasoline - by 2.5%, transport diesel - by 14.7% and electricity - by 0.7%. No change for the production of natural gas.
In August 2021 compared to July 2021 an increase is reported for the deliveries of: solid fuels - by 30.3%, liquefied petroleum gases - by 17.1% and unleaded motor gasoline - by 2.0%. At the same time a decrease is reported for the deliveries of transport diesel - by 4.8%, natural gas - by 24.3% and elect...
Production and Deliveries of Energy Products, July 2021
In July 2021 compared to June 2021 an increase is reported for the production of: solid fuels - by 97.7%, liquefied petroleum gases - by 33.3%, unleaded motor gasoline - by 8.0%, and electricity - by 18.9%. A decrease is reported for the production of transport diesel - by 5.4%. No change for the production of natural gas.
In July 2021 compared to June 2021 an increase is reported for the deliveries of: solid fuels - by 96.8%, unleaded motor gasoline - by 11.1%, transport diesel - by 31.4%, natural gas - by 12.6% and electricity - by 9.8%. No change for the deliveries of liquefied...
Production and Deliveries of Energy Products, June 2021
In June 2021 compared to May 2021 a decrease is reported for the production of: solid fuels - by 58.2%, unleaded motor gasoline - by 6.7%, transport diesel - by 9.3% and electricity - by 3.5%. No change for the production of liquefied petroleum gases and natural gas.
In June 2021 compared to May 2021 an increase is reported for the deliveries of: liquefied petroleum gases - by 6.1%, unleaded motor gasoline - by 35.3% and electricity - by 3.1%. A decrease is reported for the deliveries of: solid fuels - by 57.1% and natural gas - by 1.7%. No change for the deliveries of transport d...
Production and Deliveries of Energy Products, May 2021
In May 2021 compared to April 2021 an increase is reported for the production of solid fuels - by 29.6%, liquefied petroleum gases - by 20.0%, unleaded motor gasoline - by 93.5%, and transport diesel - by 45.6%. A decrease is reported for the production of natural gas - by 33.3% and electricity - by 13.6%.
In May 2021 compared to April 2021 an increase is reported for the deliveries of solid fuels - by 27.5%. A decrease is reported for the deliveries of liquefied petroleum gases - by 2.9%, unleaded motor gasoline - by 30.6%, transport diesel - by 12.0%, natural gas - by 20.4%, and...
Production and Deliveries of Energy Products, April 2021
In April 2021 compared to March 2021 a decrease is reported for the production of solid fuels - by 8.1%, liquefied petroleum gases - by 28.6%, unleaded motor gasoline - by 45.1%, transport diesel - by 32.7%, and electricity - by 9.4%. No change for the production of natural gas.
In April 2021 compared to March 2021 an increase is reported for the deliveries of unleaded motor gasoline - by 40.0% and transport diesel - by 31.5%. A decrease is reported for the deliveries of solid fuels - by 8.7%, liquefied petroleum gases - by 8.1%, natural gas - by 22.0%, and electricity - by 14.4%....
Production and Deliveries of Energy Products, March 2021
In March 2021 compared to February 2021 an increase is reported for the production of solid fuels - by 3.2%, liquefied petroleum gases - by 40.0%, unleaded motor gasoline - by 24.2%, transport diesel - by 45.1%, and electricity - by 13.5%. No change for the production of natural gas.
In March 2021 compared to February 2021 an increase is reported for the deliveries of solid fuels - by 4.2%, liquefied petroleum gases - by 15.6%, transport diesel - by 1.9%, natural gas - by 8.6%, and electricity - by 6.4%. A decrease is reported for the deliveries of unleaded motor gasoline - by 5.4...
Production and Deliveries of Energy Products, February 2021
In February 2021 compared to January 2021 an increase is reported for the production of solid fuels - by 7.4%, unleaded motor gasoline - by 8.3% and transport diesel - by 2.4%. A decrease is reported for the production of liquefied petroleum gases - by 16.7%, natural gas - by 25.0% and electricity - by 9.6%.
In February 2021 compared to January 2021 an increase is reported for the deliveries of solid fuels - by 5.1%, liquefied petroleum gases - by 10.3%, unleaded motor gasoline - by 5.7% and transport diesel - by 13.3%. A decrease is reported for the deliveries of natural gas - by...
Production and Deliveries of Energy Products, January 2021
In January 2021 compared to December 2020 an increase is reported for the production of liquefied petroleum gases - by 20.0% and electricity - by 6.9%. A decrease is reported for the production of solid fuels - by 17.9%, unleaded motor gasoline - by 6.7% and transport diesel - by 13.3%. No change for the production of natural gas.
In January 2021 compared to December 2020 an increase is reported for the deliveries of unleaded motor gasoline - by 12.9% and electricity - by 4.5%. A decrease is reported for the deliveries of solid fuels - by 17.1%, liquefied petroleum gases - by 9.4%...
Production and Deliveries of Energy Products, December 2020
In December 2020 compared to November 2020 an increase is reported for the production of solid fuels - by 12.9% and electricity - by 6.9%. A decrease is reported for the production of unleaded motor gasoline - by 4.3%, transport diesel - by 1.0% and natural gas - by 20.0%. No change for the production of liquefied petroleum gases.
In December 2020 compared to November 2020 an increase is reported for the deliveries of solid fuels - by 12.4%, natural gas - by 18.9% and electricity - by 10.0%. A decrease is reported for the deliveries of liquefied petroleum gases - by 13.5% and unle...
Production and Deliveries of Energy Products, November 2020
In November 2020 compared to October 2020 an increase is reported for the production of unleaded motor gasoline - by 1.1%, transport diesel - by 0.5% and electricity - by 21.2%. A decrease is reported for the production of solid fuels - by 6.7% and liquefied petroleum gases - by 28.6%. No change for the production of natural gas.
In November 2020 compared to October 2020 an increase is reported for the deliveries of liquefied petroleum gases - by 15.6%, natural gas - by 30.8% and electricity- by 16.6%. A decrease is reported for the deliveries of solid fuels - by 5.4%, unleaded mo...
Production and Deliveries of Energy Products, October 2020
In October 2020 compared to September 2020 an increase is reported for the production of solid fuels - by 31.0%, liquefied petroleum gases - by 40.0%, unleaded motor gasoline - by 2.2%, transport diesel - by 4.8%. A decrease is reported for the production of electricity - by 2.7%. No change for the production of natural gas.
In October 2020 compared to September 2020 an increase is reported for the deliveries of solid fuels - by 31.7%, transport diesel - by 13.1%, natural gas- by 44.4% and electricity- by 6.9%. A decrease is reported for the deliveries of liquefied petroleum gases...
Production and Deliveries of Energy Products, September 2020
In September 2020 compared to August 2020 a decrease is reported for the production of solid fuels - by 11.2%, liquefied petroleum gases - by 16.7%, transport diesel - by 7.0%, and electricity - by 6.9%. No change for the production of unleaded motor gasoline and natural gas.
In September 2020 compared to August 2020 an increase is reported for the deliveries of liquefied petroleum gases - by 17.5% and natural gas - by 9.6%. A decrease is reported for the deliveries of solid fuels - by 11.7%, unleaded motor gasoline - by 6.0%, transport diesel - by 17.7%, and electricity - by 3.4%...
Production and Deliveries of Energy Products, August 2020
In August 2020 compared to July 2020 an increase is reported for the production of solid fuels - by 21.2% and natural gas - by 25.0%. A decrease is reported for the production of unleaded motor gasoline - by 15.0%, transport diesel - by 11.5%, and electricity - by 1.1%. No change for the production of liquefied petroleum gases.
In August 2020 compared to July 2020 an increase is reported for the deliveries of solid fuels - by 19.9%, liquefied petroleum gases - by 5.3%, unleaded motor gasoline - by 28.2%, and transport diesel - by 12.6%. A decrease is reported for the deliveries of...
Production and Deliveries of Energy Products, July 2020
In July 2020 compared to June 2020 an increase is reported for the production of solid fuels - by 13.7%, liquefied petroleum gases - by 20.0%, unleaded motor gasoline - by 42.7%, transport diesel - by 31.2%, and electricity - by 6.3%. No change for the production of natural gas.
In July 2020 compared to June 2020 an increase is reported for the deliveries of solid fuels - by 12.6%, transport diesel - by 6.2%, and electricity - by 10.6%. A decrease is reported for the deliveries of liquefied petroleum gases - by 9.5%, unleaded motor gasoline - by 4.9%, and natural gas - by 2.3%....
Production and Deliveries of Energy Products, June 2020
In June 2020 compared to May 2020 an increase is reported for the production of solid fuels - by 6.7%, unleaded motor gasoline - by 19.0%, transport diesel - by 31.1%, and electricity - by 15.1%. No change for the production of liquefied petroleum gases and natural gas.
In June 2020 compared to May 2020 an increase is reported for the deliveries of solid fuels - by 7.8%, liquefied petroleum gases - by 16.7%, and transport diesel - by 19.0%. A decrease is reported for the deliveries of unleaded motor gasoline - by 4.7%, natural gas - by 5.4%, and electricity - by 0.3%.
...Production and Deliveries of Energy Products, May 2020
In May 2020 compared to April 2020 a decrease is reported for the production of solid fuels - by 31.6%, unleaded motor gasoline - by 40.6%, transport diesel - by 41.1%, and electricity - by 10.8%. No change for the production of liquefied petroleum gases and natural gas.
In May 2020 compared to April 2020 an increase is reported for the deliveries of liquefied petroleum gases - by 100.0%, unleaded motor gasoline - by 87.0%, and transport diesel - by 41.7%. A decrease is reported for the deliveries of solid fuels - by 30.6%, natural gas - by 20.3%, and electricity - by 9.1%. <...
Production and Deliveries of Energy Products, April 2020
In April 2020 compared to March 2020 a decrease is reported for the production of solid fuels - by 11.5%, liquefied petroleum gases - by 37.5%, unleaded motor gasoline - by 17.2%, transport diesel - by 10.4%, natural gas - by 20.0% and electricity - by 21.5%.
In April 2020 compared to March 2020 a decrease is reported for the deliveries of solid fuels - by 11.4%, liquefied petroleum gases - by 40.0%, unleaded motor gasoline - by 17.9%, transport diesel - by 30.7%, natural gas - by 23.2% and electricity - by 16.1%.
...Production and Deliveries of Energy Products, March 2020
In March 2020 compared to February 2020 an increase is reported for the production of electricity - by 3.3%. During the same period, a decrease is reported for the production of solid fuels - by 16.7%, liquefied petroleum gases - by 20.0%, unleaded motor gasoline - by 7.2% and transport diesel - by 2.3%. No change for the production of natural gas.
In March 2020 compared to February 2020 an increase is reported for the deliveries of transport diesel - by 10.7%. During the same period, a decrease is reported for the deliveries of solid fuels - by 16.2%, liquefied petroleum gases - ...
Production and Deliveries of Energy Products, February 2020
In February 2020 compared to January 2020 an increase is reported for the production of solid fuels - by 2.6%. During the same period, a decrease is reported for the production of unleaded motor gasoline - by 7.4%, transport diesel - by 1.2%, natural gas - by 16.7% and electricity - by 4.5%. No change for the production of liquefied petroleum gases.
In February 2020 compared to January 2020 an increase is reported for the deliveries of solid fuels - by 2.8%. During the same period, a decrease is reported for the deliveries of liquefied petroleum gases - by 20.9%, unleaded motor gasoli...
Production and Deliveries of Energy Products, January 2020
In January 2020 compared to December 2019 an increase is reported for the production of unleaded motor gasoline - by 1.4% and natural gas - by 20.0%. During the same period, a decrease is reported for the production of solid fuels - by 9.1%, transport diesel - by 2.6%, and electricity - by 2.7%. No change for the production of liquefied petroleum gases.
In January 2020 compared to December 2019 an increase is reported for the deliveries of liquefied petroleum gases - by 4.9%, unleaded motor gasoline - by 21.2%, natural gas - by 7.8%, and electricity - by 8.8%. During the same period, ...
Production and Deliveries of Energy Products, December 2019
In December 2019 compared to November 2019 an increase is reported for the production of solid fuels - by 9.4% and electricity - by 7.5%. During the same period, a decrease is reported for the production of liquefied petroleum gases - by 16.7% and transport diesel - by 3.6%. No change for the production of unleaded motor gasoline, but a growth is observed for the production of natural gas because of increased indigenous extraction.
In December 2019 compared to November 2019 an increase is reported for the deliveries of solid fuels - by 9.1%, liquefied petroleum gases - by 17.1%, trans...
Production and Deliveries of Energy Products, November 2019
In November 2019 compared to October 2019 an increase is reported for the production of electricity - by 11.6%. During the same period, a decrease is reported for the production of solid fuels - by 14.5%, liquefied petroleum gases - by 7.7%, unleaded motor gasoline - by 6.4%, transport diesel - by 9.5% and natural gas - by 50.0%.
In November 2019 compared to October 2019 an increase is reported for the deliveries of unleaded motor gasoline - by 11.1%, natural gas - by 41.5% and electricity - by 7.8%. During the same period, a decrease is reported for the deliveries of solid fuels - by...
Production and Deliveries of Energy Products, October 2019
In October 2019 compared to September 2019 an increase is reported for the production of solid fuels - by 13.0%, unleaded motor gasoline - by 3.3%, transport diesel - by 10.1% and electricity - by 2.9%. No change for the production of liquefied petroleum gases and natural gas.
In October 2019 compared to September 2019 an increase is reported for the deliveries of solid fuels - by 14.2%, liquefied petroleum gases - by 2.6%, natural gas - by 14.4% and electricity - by 6.0%. A decrease is reported for the deliveries of unleaded motor...
Production and Deliveries of Energy Products, September 2019
In September 2019 compared to August 2019 an increase is reported for the production of solid fuels - by 23.0%, liquefied petroleum gases - by 18.2% and transport diesel - by 1.1%. During the same period, a decrease is reported for the production of unleaded motor gasoline - by 5.6% and electricity - by 10.0%. No change for the production of natural gas.
In September 2019 compared to August 2019 an increase is reported for the deliveries of solid fuels - by 20.0% and natural gas - by 6.0%. A decrease is reported for the deliveries of liquefied petroleum gases - by 11.6%, unleaded moto...
Production and Deliveries of Energy Products, August 2019
In August 2019 compared to July 2019 an increase is reported for the production of solid fuels - by 5.0%, transport diesel - by 1.5% and electricity - by 2.7%. During the same period, a decrease is reported for the production of liquefied petroleum gases - by 8.3%. No change for the production of unleaded motor gasoline and natural gas.
In August 2019 compared to July 2019 an increase is reported for the deliveries of solid fuels - by 3.9%. A decrease is reported for the deliveries of liquefied petroleum gases - by 4.4%, unleaded motor gasoline - by 1.9%, tr...
Production and Deliveries of Energy Products, July 2019
In July 2019 compared to June 2019 an increase is reported for the production of solid fuels - by 34.9%, liquefied petroleum gases - by 20.0%, unleaded motor gasoline - by 3.9% and electricity - by 16.6%. During the same period, a decrease is reported for the production of transport diesel - by 4.3%. No change for the production of natural gas.
In July 2019 compared to June 2019 an increase is reported for the deliveries of solid fuels - by 34.1%, unleaded motor gasoline - by 18.2%, transport diesel - by 19.3%, natural gas - by 4.0% and electricity - by 6.2%. A decrease is reported fo...
Production and Deliveries of Energy Products, June 2019
In June 2019 compared to May 2019 an increase is reported for the production of and transport diesel - by 0.7% and electricity - by 0.8%. During the same period, a decrease is reported for the production of solid fuels - by 38.3%, liquefied petroleum gases - by 9.1%, unleaded motor gasoline - by 2.5%. No change for the production of natural gas.
In June 2019 compared to May 2019 an increase is reported for the deliveries of liquefied petroleum gases - by 14.3%. A decrease is reported for the deliveries of solid fuels - by 37.3%, unleaded motor gasoline - by 2.2%, natural gas - by 13.7...
Production and Deliveries of Energy Products, May 2019
In May 2019 compared to April 2019 an increase is reported for the production of solid fuels - by 24.5% and transport diesel - by 4.5%. During the same period, a decrease is reported for the production of unleaded motor gasoline - by 3.6% and electricity - by 16.5%. No change for the production of liquefied petroleum gases and natural gas.
In May 2019 compared to April 2019 an increase is reported for the deliveries of solid fuels - by 25.3% and liquefied petroleum gases - by 7.7%. A decrease is reported for the deliveries of unleaded motor gasoline - by 8.2%, transport diesel - by 10...
Production and Deliveries of Energy Products, April 2019
In April 2019 compared to March 2019 an increase is reported for the production of liquefied petroleum gases - by 37.5%, unleaded motor gasoline - by 91.9% and transport diesel - by 52.3%. Compared to March 2019, when reduced production of LPG, unleaded motor gasoline and transport diesel is observed due to planned repairs of capacities, production in April 2019 reaches its normal monthly volumes. During the same period, a decrease is reported for the production of solid fuels - by 10.8%, natural gas - by 33.3% and electricity - by 8.5%.
In April 2019 compared to March 2019 an increas...
Production and Deliveries of Energy Products, March 2019
In March 2019 compared to February 2019 an increase is reported for the production of natural gas - by 50.0%. During the same period, a decrease is reported for the production of solid fuels - by 23.5%, liquefied petroleum gases - by 11.1%, unleaded motor gasoline - by 39.9%, transport diesel - by 27.0%, and electricity - by 4.4%.
In March 2019 compared to February 2019 an increase is reported for the deliveries of unleaded motor gasoline - by 11.1% and transport diesel - by 23.0%. A decrease is reported for the deliveries of solid fuels - by 22.7%, natural gas - by 10.5% and electric...
Production and Deliveries of Energy Products, February 2019
In February 2019 compared to January 2019 a decrease is reported for the production of solid fuels - by 24.6%, unleaded motor gasoline - by 10.1%, transport diesel - by 15.4%, natural gas - by 33.3% and electricity - by 9.1%. No change for the production of liquefied petroleum gases.
In February 2019 compared to January 2019 a decrease is reported for the deliveries of solid fuels - by 23.8%, liquefied petroleum gases - by 2.6%, unleaded motor gasoline - by 12.2%, transport diesel - by 2.6%, natural gas - by 20.2% and electricity - by 16.8%.
...Production and Deliveries of Energy Products, January 2019
In January 2019 compared to December 2018 an increase is reported for the production of solid fuels - by 4.3% and transport diesel - by 1.4%. At the same time a decrease is reported for the production of unleaded motor gasoline - by 4.8% and electricity - by 3.5%. No change for the production of liquefied petroleum gases and natural gas.
In January 2019 compared to December 2018 an increase is reported for the deliveries of solid fuels - by 4.1%, unleaded motor gasoline - by 28.1%, natural gas - by 0.7% and electricity - by 4.3%. At the same time a decrease is reported for the deliver...
Production and Deliveries of Energy Products, December 2018
In December 2018 compared to November 2018 an increase is reported for the production of solid fuels - by 12.9%, unleaded motor gasoline - by 6.4%, natural gas - by 50.0% and electricity - by 7.0%. At the same time a decrease is reported for the production of liquefied petroleum gases - by 10.0%. No change for the production of transport diesel.
In December 2018 compared to November 2018 an increase is reported for the deliveries of solid fuels - by 13.0%, liquefied petroleum gases - by 39.4%, unleaded motor gasoline - by 18.5%, natural gas - by 30.8% and electricity - by 18.5%. At th...
Production and Deliveries of Energy Products, November 2018
In November 2018 compared to October 2018 an increase is reported for the production of electricity - by 17.1%. At the same time a decrease is reported for the production of solid fuels - by 8.6%, unleaded motor gasoline - by 6.5%, and transport diesel - by 4.4%. No change for the production of liquefied petroleum gases and natural gas.
In November 2018 compared to October 2018 an increase is reported for the deliveries of natural gas - by 36.3% and electricity - by 14.7%. At the same time a decrease is reported for the deliveries of solid fuels - by 8.3%, liquefied petroleum gases - ...
Production and Deliveries of Energy Products, October 2018
In October 2018 compared to September 2018 an increase is reported for the production of solid fuels - by 18.2%, liquefied petroleum gases - by 25.0%, unleaded motor gasoline - by 5.0%, transport diesel - by 18.1% and electricity - by 5.3%. No change for the production of natural gas.
In October 2018 compared to September 2018 an increase is reported for the deliveries of solid fuels - by 16.8%, unleaded motor gasoline - by 40.5%, transport diesel - by 2.5%, natural gas - by 22.2%, electricity - by 9.9%. At the same time a decrease is reported for the deliveries of liquefied petroleum...
Production and Deliveries of Energy Products, September 2018
In September 2018 compared to August 2018 an increase is reported for the production of solid fuels by 29.7%. At the same time a decrease is reported for the production of liquefied petroleum gases - by 20.0%, transport diesel - by 3.5% and electricity - by 9.2%. No change for the production of unleaded motor gasoline.
In September 2018 compared to August 2018 an increase is reported for the deliveries of solid fuels - by 28.6% and natural gas - by 16.4%. At the same time a decrease is reported for the deliveries of unleaded motor gasoline - by 14.3%, transport diesel - by 8.3% and el...
Production and Deliveries of Energy Products, August 2018
In August 2018 compared to July 2018 an increase is reported for the production of solid fuels - by 0.9%, transport diesel - by 2.4% and electricity - by 4.8%. At the same time a decrease is reported for the production of unleaded motor gasoline - by 13.0%. No change for the production of liquefied petroleum gases.
In August 2018 compared to July 2018 an increase is reported for the deliveries of solid fuels - by 0.3%, liquefied petroleum gases - by 23.7%, unleaded motor gasoline - by 8.9%, transport diesel - by 0.9% and electricity - by 1.9%. At the same time a decrease is reported f...
Production and Deliveries of Energy Products, July 2018
In July 2018 compared to June 2018 an increase is reported for the production of liquefied petroleum gases - by 25.0%, unleaded motor gasoline - by 7.6%, transport diesel - by 9.6% and electricity - by 6.3%. At the same time a decrease is reported for the production of solid fuels - by 11.8%.
In July 2018 compared to June 2018 an increase is reported for the deliveries of unleaded motor gasoline - by 7.1%, transport diesel - by 7.0% and electricity - by 4.7%. At the same time a decrease is reported for the deliveries of solid fuels - by 10.4%, liquefied petroleum gases - by 11.6% and ...
Production and Deliveries of Energy Products, June 2018
In June 2018 compared to May 2018 an increase is reported for the production of solid fuels - by 28.3% and electricity - by 19.3%. After the planned repairs of production facilities done in March - April 2018, the production of petroleum products was restored to its usual levels.
In June 2018 compared to May 2018 an increase is reported for the deliveries of solid fuels - by 28.2%, unleaded motor gasoline - by 40.0%, transport diesel - by 12.4% and electricity - by 2.5%. At the same time a decrease is reported for the deliveries of liquefied petroleum gases - by 10.4% and natural gas ...
Production and Deliveries of Energy Products, May 2018
In May 2018 compared to April 2018 an increase is reported for the production of solid fuels - by 22.8%. After the planned repairs of production facilities done in March - April 2018, the production of petroleum products was restored to levels near to its usual levels. At the same time a decrease is reported for the production of electricity - by 1.7%.
In May 2018 compared to April 2018 an increase is reported for the deliveries of solid fuels - by 22.0%, liquefied petroleum gases - by 17.1%, natural gas - by 3.0% and electricity - by 3.6%. At the same time a decrease is reported for ...
Production and Deliveries of Energy Products, April 2018
In April 2018 compared to March 2018 an insignificant increase is observed in the production of petroleum products, which is due to continuing planned repair of production capacities during this period. At the same time a decrease is reported for the production of solid fuels - by 36.1% and electricity - by 25.6%.
In April 2018 compared to March 2018 an increase is reported for the deliveries of unleaded motor gasoline by 2.4%. At the same time a decrease is reported for the deliveries of solid fuels - by 35.5%, liquefied petroleum gases - by 4.7%, natural gas - by 39.6% and electrici...
Production and Deliveries of Energy Products, March 2018
In March 2018 compared to February 2018 an increase is reported for the production of solid fuels - by 6.5% and electricity - by 4.9%. Significant drop is observed in the production of petroleum products, which is due to planned repair of production capacities done in March 2018, as a decrease is reported for the production of unleaded motor gasoline - by 99.2% and transport diesel - by 87.0%. No production of liquefied petroleum gases.
In March 2018 compared to February 2018 an increase is reported for the deliveries of solid fuels - by 4.2%, liquefied petroleum gases - by 22.9%, unl...
Production and Deliveries of Energy Products, February 2018
In February 2018 compared to January 2018 a decrease is reported for the production of solid fuels - by 21.8%, unleaded motor gasoline - by 19.4%, transport diesel - by 31.3%, and electricity - by 6.1%. No change for the production of liquefied petroleum gases.
In February 2018 compared to January 2018 an increase is reported for the deliveries of liquefied petroleum gases - by 6.1%, unleaded motor gasoline - by 9.1%, and transport diesel - by 18.5%. At the same time a decrease is reported for the deliveries of solid fuels - by 20.2%, natural gas - by 9.5%, and electricity - by 11.7%....
Production and Deliveries of Energy Products, January 2018
In January 2018 compared to December 2017 an increase is reported for the production of electricity by 0.5%. At the same time a decrease is reported for the production of solid fuels - by 4.1%, unleaded motor gasoline - by 1.2%, and transport diesel - by 9.2%. No change for the production of liquefied petroleum gases.
In January 2018 compared to December 2017 an increase is reported for the deliveries of unleaded motor gasoline - by 3.1%, natural gas - by 7.1% and electricity - by 9.2%. At the same time a decrease is reported for the deliveries of solid fuels - by 4.9%, liquefied petr...
Production and Deliveries of Energy Products, December 2017
In December 2017 compared to November 2017 an increase is reported for the production of solid fuels - by 6.8%, liquefied petroleum gases - by 11.1%, unleaded motor gasoline - by 5.2%, transport diesel - by 6.7% and electricity - by 2.7%.
In December 2017 compared to November 2017 an increase is reported for the deliveries of solid fuels - by 7.7%, transport diesel - by 1.2%, natural gas - by 10.6% and electricity - by 7.1%. At the same time a decrease is reported for the deliveries of unleaded motor gasoline - by 36.0%. No change for the deliveries of liquefied petroleum gases.
...Production and Deliveries of Energy Products, November 2017
In November 2017 compared to October 2017 an increase is reported for the production of transport diesel - by 7.6% and electricity - by 17.3%. A decrease is reported for the production of solid fuels - by 16.7% and liquefied petroleum gases - by 10.0%. No change for the production of unleaded motor gasoline.
In November 2017 compared to October 2017 an increase is reported for the deliveries of unleaded motor gasoline - by 35.1%, natural gas - by 33.1% and electricity - by 11.5%. At the same time a decrease is reported for the deliveries of solid fuels - by 16.2%, liquefied petroleum ...
Production and Deliveries of Energy Products, October 2017
In October 2017 compared to September 2017 an increase is reported for the production of solid fuels - by 13.0%, unleaded motor gasoline - by 0.7% and electricity - by 0.2%. A decrease is reported for the production of transport diesel - by 6.3% and natural gas - by 25.0%. No change for the production of liquefied petroleum gases.
In October 2017 compared to September 2017 an increase is reported for the deliveries of solid fuels - by 12.7%, liquefied petroleum gases - by 2.3%, transport diesel - by 1.4%, natural gas - by 33.3% and electricity - by 9.7%. At the same time a decrease is...
Production and Deliveries of Energy Products, September 2017
In September 2017 compared to August 2017 an increase is reported for the production of solid fuels - by 12.1% and unleaded motor gasoline - by 4.4%. A decrease is reported for the production of liquefied petroleum gases - by 9.1%, transport diesel - by 6.9%, natural gas - by 20.0% and electricity - by 10.2%.
In September 2017 compared to August 2017 an increase is reported for the deliveries of solid fuels - by 12.1%, unleaded motor gasoline - by 3.9% and natural gas - by 11.4%. At the same time a decrease is reported for the deliveries of liquefied petroleum gases - by 13.7%, transp...
Production and Deliveries of Energy Products, August 2017
In August 2017 compared to July 2017 an increase is reported for the production of solid fuels - by 4.4%, unleaded motor gasoline - by 1.3%, transport diesel - by 2.2% and electricity - by 1.9%. There is no change in the production of liquefied petroleum gases and natural gas.
In August 2017 compared to July 2017 an increase is reported for the deliveries of solid fuels - by 3.3%, liquefied petroleum gases - by 15.9%, unleaded motor gasoline - by 37.8%, transport diesel - by 24.1% and electricity - by 0.7%. At the same time a decre...
Production and Deliveries of Energy Products, July 2017
In July 2017 compared to June 2017 an increase is reported for the production of solid fuels - by 3.7%, liquefied petroleum gases - by 10.0%, unleaded motor gasoline - by 1.9% and electricity - by 12.1%. At the same time a decrease is reported for the production of transport diesel - by 0.4% and natural gas - by 16.7%.
In July 2017 compared to June 2017 an increase is reported for the deliveries of solid fuels - by 4.7% and electricity - by 6.1%. At the same time a decrease is reported for the deliveries of liquefied petroleum gases - by 8.3%, unleaded motor gasoline - by 28.8%, trans...
Production and Deliveries of Energy Products, June 2017
In June 2017 compared to May 2017 an increase is reported for the production of electricity by 3.7%. At the same time a decrease is reported for the production of solid fuels - by 12.8%, liquefied petroleum gases - by 9.1%, unleaded motor gasoline - by 3.1%, transport diesel - by 4.9% and natural gas - by 33.3%.
In June 2017 compared to May 2017 an increase is reported for the deliveries of liquefied petroleum gases - by 6.7%, unleaded motor gasoline - by 10.6% and transport diesel - by 26.6%. At the same time a decrease is reported for the deliveries of solid fuels - by 13.4%, natura...
Production and Deliveries of Energy Products, May 2017
In May 2017 compared to April 2017 an increase is reported for the production of solid fuels by 21.0%, unleaded motor gasoline - by 1.9% and transport diesel - by 11.3%. At the same time a decrease is reported for the production of electricity by 6.4% and no change for the production of liquefied petroleum gases and natural gas.
In May 2017 compared to April 2017 an increase is reported for the deliveries of solid fuels - by 20.9% and unleaded motor gasoline - by 14.6%. At the same time a decrease is reported for the deliveries of transport diesel - by 16.8%, natural gas - by 15.7% an...
Production and Deliveries of Energy Products, April 2017
In April 2017 compared to March 2017 an increase is reported for the production of liquefied petroleum gases - by 22.2%, unleaded motor gasoline - by 26.6% and transport diesel - by 39.7%. At the same time a decrease is reported for the production of solid fuels by 1.3%, natural gas - by 10.0% and electricity - by 13.4%.
In April 2017 compared to March 2017 an increase is reported for the deliveries of liquefied petroleum gases - by 18.4%, unleaded motor gasoline - by 2.5%, and transport diesel - by 17.8%. At the same time a decrease is reported for the deliveries of solid fuels - by ...
Production and Deliveries of Energy Products, March 2017
In March 2017 compared to February 2017 a decrease is reported for the production of solid fuels by 31.4%, unleaded motor gasoline - by 17.9%, transport diesel - by 23.3%, natural gas - by 9.1% and electricity - by 2.5%. No change for the production of liquefied petroleum gases.
In March 2017 compared to February 2017 an increase is reported for the deliveries of liquefied petroleum gases - by 15.2%, unleaded motor gasoline - by 33.3%, and transport diesel - by 12.9%. At the same time a decrease is reported for the deliveries of so...
Production and Deliveries of Energy Products, February 2017
In February 2017 compared to January 2017 an increase is reported for the production of solid fuels by 4.4%. At the same time a decrease is reported for the production of liquefied petroleum gases - by 10.0%, unleaded motor gasoline - by 8.5%, transport diesel - by 6.3%, natural gas - by 8.3% and electricity - by 13.8%.
In February 2017 compared to January 2017 an increase is reported for the deliveries of solid fuels - by 3.0% and transport diesel - by 13.9%. At the same time a decrease is reported for the deliveries of liquefied petroleum gases - by 13.2%, unleaded motor gasoline - ...
Production and Deliveries of Energy Products, January 2017
In January 2017 compared to December 2016 an increase is reported for the production of electricity - by 3.5%. At the same time a decrease is reported for the production of solid fuels by 5.0%, unleaded motor gasoline - by 8.3%, transport diesel - by 6.9%, natural gas - by 20.0%. No change is reported for the production of liquefied petroleum gases.
In January 2017 compared to December 2016 an increase is reported for the deliveries of natural gas by 15.8% and electricity - by 15.2%. At the same time a decrease is reported for the deliveries of solid fuels - by 4.4%, liquefied petrole...
Production and Deliveries of Energy Products, December 2016
In December 2016 compared to November 2016 an increase is reported for the production of solid fuels by 1.0%, liquefied petroleum gases - by 11.1%, unleaded motor gasoline - by 7.1%, natural gas - by 36.4% and electricity - by 18.1%. At the same time a decrease is reported for the production of transport diesel by 0.7%.
In December 2016 compared to November 2016 an increase is reported for the deliveries of solid fuels by 0.3%, liquefied petroleum gases - by 4.8%, unleaded motor gasoline - by 35.1%, natural gas - by 21.3% and electricity - by 18.7%. At the same time a decrease is repo...
Production and Deliveries of Energy Products, November 2016
In November 2016 compared to October 2016 an increase is reported for the production of unleaded motor gasoline by 1.8%, transport diesel - by 2.2%, natural gas - by 37.5% and electricity - by 5.6%. At the same time a decrease is reported for the production of solid fuels by 1.7%. No change for the production of liquefied petroleum gases.
In November 2016 compared to October 2016 an increase is reported for the deliveries of transport diesel by 7.8%, natural gas - by 22.3% and electricity - by 10.4%. At the same time a decrease is reported for the deliveries of solid fuels by 1.3% and...
Bulgaria 2024
The National Statistical Institute presents the bilingual (Bulgarian/English) brochure Bulgaria 2024 to the users of statistical information. The brochure is addressed to a wide range of users (international institutions, representatives of business, students, experts etc.) and changes the traditional presentation of statistical information by offering an innovative structure with a parallel translation in English.
The publication contains up-to-date statistical information about the demographic, social and economic development of the country over the 2018 - 2023 ...
Statistical Yearbook 2023
The National Statistical Institute (NSI) has the pleasure to present to the attention of national and foreign users of statistical information the 91-st edition of the ‘Statistical Yearbook of the Republic of Bulgaria’ in printed format.
It provides current statistical information about the demographic, economic and social development of the country for 2017 - 2022 in different territorial and classification aggregations and breakdowns.
According to the Law on Statistics, official source of information in the Republic of Bulgaria is the National Statistical Sys...
Energy Balances 2022
The National Statistical Institute presents to the users of statistical information the annual electronic publication ‘Energy Balances 2022’. The publication is bilingual (in Bulgarian and English) and contains data from surveys of the National Statistical Institute in the field of energy statistics for the period 2016 - 2022.
The issue presents a broad range of data about:
• Commodity energy balances - solid fossil fuels, crude oil and petroleum products, natural gas, renewables, electricity and heat;
• Overall energy balance sheet;
• Primary energy produc...
Statistical Yearbook 2022
The National Statistical Institute (NSI) has the pleasure to present to the attention of national and foreign users of statistical information the 90th edition of the ‘Statistical Yearbook of the Republic of Bulgaria’ in printed format.
It provides current statistical information about the demographic, economic and social development of the country for 2016 - 2021 in different territorial and classification aggregations and breakdowns.
According to the Law on Statistics, official source of information in the Republic of Bulgaria is the National Statistical ...
Energy Balance Sheets 2021
The National Statistical Institute presents to the users of statistical information the annual electronic publication ‘Energy Balances 2021’. The publication is bilingual (in Bulgarian and English) and contains data from surveys of the National Statistical Institute in the field of energy statistics for the period 2015 - 2021.
The issue presents a broad range of data about:
• Commodity energy balances - solid fossil fuels, crude oil and petroleum products, natural gas, renewables, electricity and heat;
• Overall energy balan...
Bulgaria 2022
The National Statistical Institute presents the bilingual (Bulgarian/English) brochure Bulgaria 2022 to users of statistical information. The brochure is addressed to a wide range of users (international institutions, business, students, experts etc.) and changes the traditional presentation of statistical information by offering an innovative structure with a parallel translation in English. The publication contains topical statistical information about the demographic, social and economic development of the country over the 2016 - 2021 period. It also includes n...
Statistical Yearbook 2021
The National Statistical Institute (NSI) has the pleasure to present to the attention of national and foreign users of statistical information the 89th edition of the ‘Statistical Yearbook of the Republic of Bulgaria’ in printed and electronic format.
It provides current statistical information about the demographic, economic and social development of the country for 2015 - 2020 in different territorial and classification aggregations and breakdowns.
According to the Law on Statistics, official source of information in the Republic of Bulgaria is the ...
Energy Balance Sheets 2020

The National Statistical Institute presents to the users of statistical information the annual electronic publication ‘Energy Balances 2020’. The publication is bilingual (in Bulgarian and English) and contains data from surveys of the National Statistical Institute in the field of energy statistics for the period 2014 - 2020.
The issue presents a broad range of data about:
• Commodity energy balances - solid fossil fuels, crude oil and petroleum products, natural gas, renewables, electricity and heat;
• Overall energy balan...
Statistical Yearbook 2020
The National Statistical Institute (NSI) has the pleasure to present to the attention of national and foreign users of statistical information the 88th edition of the ‘Statistical Yearbook of the Republic of Bulgaria’ in printed and electronic format.
It provides current statistical information about the demographic, economic and social development of the country for 2014 - 2019 in different territorial and classification aggregations and breakdowns.
According to the Law on Statistics, official source of information in the Republic of Bulgaria is the ...
Bulgaria 2021
The National Statistical Institute presents the bilingual (Bulgarian/English) brochure Bulgaria 2021 to users of statistical information. The brochure is addressed to a wide range of users (international institutions, business, students, experts etc.) and changes the traditional presentation of statistical information by offering an innovative structure with a parallel translation in English. The publication contains topical statistical information about the demographic, social and economic development of the country over the 2015 - 2020 period. It also includes non-traditional i...
Energy Balance Sheets 2019
The National Statistical Institute presents to the users of statistical information the annual electronic publication ‘Energy Balances 2019’. The publication is bilingual (in Bulgarian and English) and contains data from surveys of the National Statistical Institute in the field of energy statistics for the period 2013 - 2019.
The issue presents a broad range of data about:
• Commodity energy balances - solid fossil fuels, crude oil and petroleum products, natural gas, renewables, electricity and heat;
• Overall energy balance sheet;
• ...
Statistical Yearbook 2012
The National Statistical Institute (NSI) has the pleasure to submit to the attention of national and foreign users of statistical information the 80th edition of the ‘Statistical Yearbook of the Republic of Bulgaria’ in printed and electronic format.
It provides current statistical information about the demographic, economic and social development of the country for the 2007 - 2011 period in different territorial and classification aggregations and breakdowns.
Accor...
Bulgaria 2020
The National Statistical Institute presents the bilingual (Bulgarian/English) brochure Bulgaria 2020 to users of statistical information. The brochure is addressed to a wide range of users (international institutions, business, students, experts etc.) and changes the traditional presentation of statistical information by offering an innovative structure with a parallel translation in English. The publication contains topical statistical information about the demographic, social and economic development of the country over the 2014 - 2019 period. It also includes non-trad...
Statistical Yearbook 2019
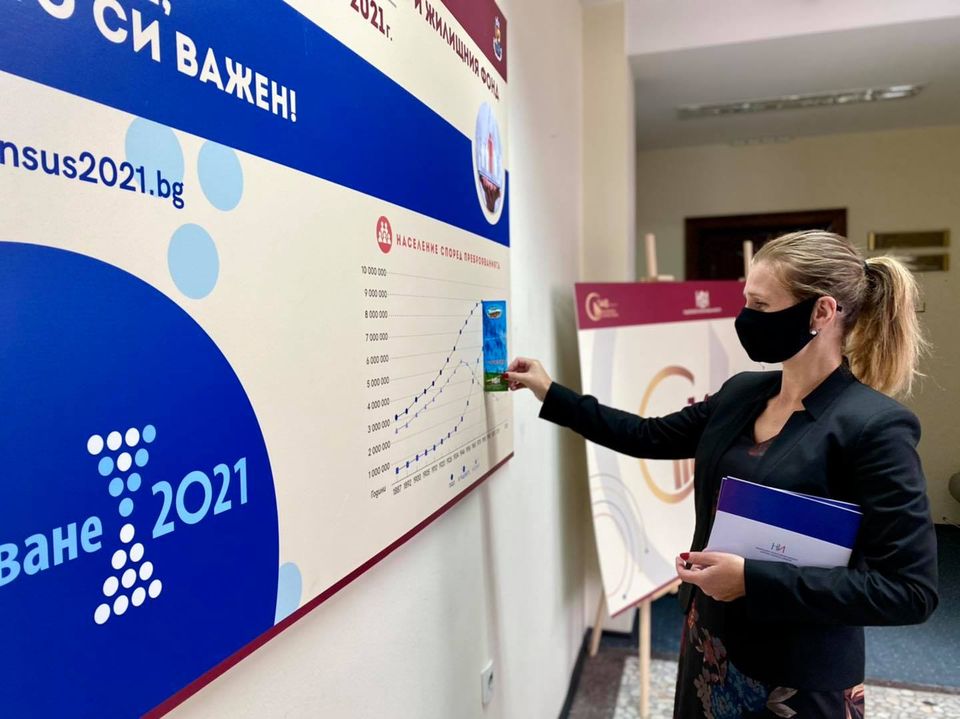
The National Statistical Institute (NSI) has the pleasure to present to the attention of national and foreign users of statistical information the 87th edition of the ‘Statistical Yearbook of the Republic of Bulgaria’ in printed and electronic format.
It provides current statistical information about the demographic, economic and social development of the country for 2013 - 2018 in different territorial and classification aggregations and breakdowns.
According to the Law on Statistics, official source of information in the Republic of Bulgaria is the ...
Energy Balance Sheets 2018
The National Statistical Institute presents to the attention of the users of statistical information its new electronic publication Energy Balance Sheets 2018. The annual bilingual publication contains data for the period 2012 - 2018 on energy statistics obtained from the current surveys of the National Statistical Institute.
The issue presents also detailed information on:
• Commodity energy balances - solid fossil fuels, crude oil and petroleum products, natural gas, renewables, electricity and heat;
• Overall ene...
Statistical Yearbook 2018 in infographics
The National Statistical Institute presents to your attention the 86th edition of the Statistical Yearbook of the Republic of Bulgaria in infographics.
In 2018, for the first time, we presented the results of the statistical surveys through graphics, images and other visualization tools, which resulted in a positive response among a wide range of users. We believe that this modern way of presenting statistical information will trigger the interest in those who for the first time encounter the meaning of numbers revealing important aspects of socio-economic life.
...Statistical Yearbook 2018

The National Statistical Institute (NSI) has the pleasure to present to the attention of national and foreign users of statistical information the 86th edition of the ‘Statistical Yearbook of the Republic of Bulgaria’ in printed and electronic format.
It provides current statistical information about the demographic, economic and social development of the country for 2012 - 2017 in different territorial and classification aggregations and breakdowns.
According to the Law on Statistics, official source of information in the Republic of Bulgaria is the ...
Energy Balance Sheets 2017

The National Statistical Institute presents to the attention of the users of statistical information its new electronic publication Energy Balance Sheets 2017. The annual bilingual publication contains data for the period 2011 - 2017 on energy statistics obtained from the current surveys of the National Statistical Institute.
The issue presents also detailed information on:
• Commodity energy balances - solid fossil fuels, crude oil and petroleum produ...
Statistical Yearbook 2017 in infographics
The National Statistical Institute of Bulgaria offers a different view of the statistical information included in the 85th edition of the Statistical Yearbook of the Republic of Bulgaria.
The publication is intended for a wider audience as statistical data are presented in a plain and easy understandable way.
The current state and changes in the socio-economic and cultural life in the country are presented not in the traditional way in tables and text, but through infographics - images, graphics and other visualization tools.
We belie...
Statistical Yearbook 2017
The National Statistical Institute (NSI) has the pleasure to present to the attention of national and foreign users of statistical information the 84th edition of the ‘Statistical Yearbook of the Republic of Bulgaria’ in printed and electronic format.
It provides current statistical information about the demographic, economic and social development of the country for 2012 - 2016 in different territorial and classification aggregations and breakdowns.
According to the Law on Statistics, official source of information in the Republic of Bulgaria is the ...
Bulgaria 2018
The National Statistical Institute presents the bilingual (Bulgarian/English) brochure Bulgaria 2018 to users of statistical information. The brochure is addressed to a wide range of users (international institutions, business, students, experts etc.) and changes the traditional presentation of statistical information by offering an innovative structure with a parallel translation in English. The publication contains topical statistical information about the demographic, social and economic development of the country over the 2013 - 2017 period. It also includes non-trad...
Energy Balance Sheets 2016

The National Statistical Institute presents to the attention of the users of statistical information its new electronic publication Energy Balance Sheets 2016. The annual bilingual publication contains data for the period 2010 - 2016 on energy statistics obtained from the current surveys of the National Statistical Institute.
The issue presents also detailed information on:
• Commodity energy balances - coal and coal products, crude oil and petroleum products, natural gas, renewables, electricity a...
Bulgaria 2017
The National Statistical Institute presents the bilingual (Bulgarian/English) brochure Bulgaria 2017 to users of statistical information. The brochure is addressed to a wide range of users (international institutions, business, students, experts etc.) and changes the traditional presentation of statistical information by offering an innovative structure with a parallel translation in English. The publication contains topical statistical information about the demographic, social and economic development of the country over the 2012 - 2016 period. It also includes non-traditional i...
Statistical Yearbook 2016
The National Statistical Institute (NSI) has the pleasure to present to the attention of national and foreign users of statistical information the 84th edition of the ‘Statistical Yearbook of the Republic of Bulgaria’ in printed and electronic format.
It provides current statistical information about the demographic, economic and social development of the country for 2011 - 2015 in different territorial and classification aggregations and breakdowns.
According to the Law on Statistics, official source of information in the Republic of Bulgaria is the ...
Energy Balance Sheets 2015
The National Statistical Institute has the pleasure to present of users on statistical information its new electronic publication Energy Balance Sheets 2015. The annual bilingual publication contains data for 2009 - 2015 period on energy statistics obtained from the current surveys of the National Statistical Institute.
The issue presents also detailed information on:
• Commodity energy balances - coal and coal products, crude oil and petroleum products, natural gas, renewables, electricity and heat;
Bulgaria 2016
The National Statistical Institute presents the bilingual (Bulgarian/English) brochure Bulgaria 2016 to users of statistical information. The brochure is addressed to a wide range of users (international institutions, businessmen, students, experts etc.) and changes the traditional presentation of statistical information by offering an innovative structure with a parallel translation in English. The publication contains topical statistical information about the demographic, social and economic development of the country over the 2011 - 2015 period. It also includes non-traditiona...
Statistical Yearbook 2015
The National Statistical Institute (NSI) has the pleasure to present to the attention of national and foreign users of statistical information the 83rd edition of the ‘Statistical Yearbook of the Republic of Bulgaria’ in printed and electronic format.
It provides current statistical information about the demographic, economic and social development of the country for 2010 - 2014 in different territorial and classification aggregations and breakdowns.
According to the Law on Statistics, official source of information in the Republic of Bulgaria is the ...
Energy Balance Sheets 2014
The National Statistical Institute has the pleasure to present of users on statistical information its new electronic publication Energy Balance Sheets 2014. The annual bilingual publication contains data for 2008 - 2014 period on energy statistics obtained from the current surveys of the National Statistical Institute.
The issue presents also detailed information on:
• Commodity energy balances - coal and coal products, crude oil and petroleum products, natural gas, renewables, electricity and heat;
Bulgaria 2015
The National Statistical Institute presents the bilingual (Bulgarian/English) brochure Bulgaria 2015 to users of statistical information. The brochure is addressed to a wide range of users (international institutions, businessmen, students, experts etc.) and changes the traditional presentation of statistical information by offering an innovative structure with a parallel translation in English. The publication contains topical statistical information about the demographic, social and economic development of the country over the 2010 - 2014 period. It also includes non-tra...
Statistical Yearbook 2014
The National Statistical Institute (NSI) has the pleasure to present to the attention of national and foreign users of statistical information the 82nd edition of the ‘Statistical Yearbook of the Republic of Bulgaria’ in printed and electronic format.
It provides current statistical information about the demographic, economic and social development of the country for 2009 - 2013 in different territorial and classification aggregations and breakdowns.
According to the Law on Statistics, official source of information in the Republic of Bulgaria is the Nati...
Energy Balance Sheets 2013
The National Statistical Institute has the pleasure to present of users on statistical information its new electronic publication Energy Balance Sheets 2013. The annual bilingual publication contains data for 2007 - 2013 period on energy statistics obtained from the current surveys of the National Statistical Institute.
The issue presents also detailed information on:
• Commodity energy balances - coal and...
Bulgaria 2014

The National Statistical Institute presents the bilingual (Bulgarian/English) brochure Bulgaria 2014 to users of statistical information. The brochure is addressed to a wide range of users (international institutions, businessmen, students, experts etc.) and changes the traditional presentation of statistical information by offering an innovative structure with a parallel translation in English. The publication contains topical statistical information about the demographic, social and economic development of the country over the 2008 - 2013 period. It also includes non-traditional ...
Statistical Yearbook 2013

The National Statistical Institute (NSI) has the pleasure to present to the attention of national and foreign users of statistical information the 81st edition of the ‘Statistical Yearbook of the Republic of Bulgaria’ in printed and electronic format.
It provides current statistical information about the demographic, economic and social development of the country for 2008 - 2012 in different territorial and classification aggregations and breakdowns.
According to the Law on Statistics, official source of information in the Republic of Bulgaria is the Nati...
Energy Balance Sheets 2012
The annual bilingual publication ‘Energy Balance Sheets 2012’ contains data for 2006 - 2012 on energy statistics obtained from current surveys of the National Statistical Institute.
The publication presents also detailed information on:
• Commodity energy balances - coal and coal products, crude oil and petroleum products, natural gas, renewables, electricity and heat;
• Overall energy balance sheet;...
Bulgaria 2013

The National Statistical Institute presents the bilingual (Bulgarian/English) brochure Bulgaria 2013 to users of statistical information. The brochure is addressed to a wide range of users (international institutions, businessmen, students, experts etc.) and changes the traditional presentation of statistical information by offering an innovative structure with a parallel translation in English. The publication contains topical statistical information about the demographic, social and economic development of the country over the 2007 - 2012 period. It also inc...
Energy Balance Sheets 2011
The National Statistical Institute presents to users of statistical information the electronic bilingual (Bulgarian/English) publication “Energy balance sheets 2011”.
The issue contains data for 2005 - 2011 on energy statistics obtained from the current surveys of the National Statistical Institute.
The publication presents also detailed information on:
• Commodity energy balances - coal and coal products, crude oil and petroleum products, natural gas, renewables, electricity and heat;
Bulgaria 2012
The National Statistical Institute presents the bilingual (Bulgarian/English) brochure Bulgaria 2012 to users of statistical information. The brochure is addressed to a wide range of users (international institutions, businessmen, students, experts etc.) and changes the traditional presentation of statistical information by offering an innovative structure with a parallel translation in English. The publication contains topical statistical information about the demographic, social and economic development of the country over the 2006 - 2011 period. It also inc...
Statistical Yearbook 2011
The National Statistical Institute (NSI) has the pleasure to submit to the attention of national and foreign users of statistical information the 79th edition of the ‘Statistical Yearbook of the Republic of Bulgaria’ in printed and electronic format.
It provides current statistical information about the demographic, economic and social development of the country for the 2005 - 2010 period in different territorial and classification aggregations and breakdowns.
According ...
Energy Balance Sheets 2010
The NSI annual electronic publication ‘Energy Balance Sheets 2010’ is available for users of statistical information. The issue is bilingual (Bulgarian/English) and contains the data for 2005 - 2010 on energy statistics obtained from the current surveys of the National Statistical Institute.
The publication presents also detailed information on:
• Commodity energy balances - coal and coal products, crude oil and petroleum products, natural gas, renewables, electricity and heat;
• Overal...
Bulgaria 2011

The National Statistical Institute presents the bilingual (Bulgarian/English) brochure Bulgaria 2011 to users of statistical information. The brochure is addressed to a wide range of users (international institutions, businessmen, students, experts etc.) and changes the traditional presentation of statistical information by offering an innovative structure with a parallel translation in English. The publication contains topical statistical information about the demographic, social and economic development of the country over the 2005 - 2010 period. It als...
Statistical Yearbook 2010
The National Statistical Institute (NSI) has the pleasure to submit to the attention of national and foreign users of statistical information the 78th edition of the ‘Statistical Yearbook of the Republic of Bulgaria’ in printed and electronic format.
It provides current statistical information about the demographic, economic and social development of the country for the 2004 - 2009 period in different territorial and classification aggregations and breakdowns.
Accor...
Energy Balance Sheets 2009
The annual bilingual publication ‘Energy Balance Sheets 2009’ contains the data for 2004 - 2009 on energy statistics obtained from the current surveys of the National Statistical Institute.
The publication presents also detailed information on:
• Commodity energy balances - coal and coal products, crude oil and petroleum products, natural gas, renewables, electricity and heat
• Overall energy balance
• Primary energy production
...
Statistical Yearbook 2009
The National Statistical Institute (NSI) has the pleasure to submit to the attention of national and foreign users of statistical information the 77th edition of the ‘Statistical Yearbook of the Republic of Bulgaria’ in printed and electronic format. The issue is published in 2010, which marks 130 years since the establishment of a statistical institution in Bulgaria and 100 years since publishing of the first ‘Statistical Yearbook of the Bulgarian Kingdom’ in 1910.
This issue has new design and layout. It provides current statistical information about ...
Bulgaria 2010
The National Statistical Institute presents the bilingual (Bulgarian/English) brochure Bulgaria 2010 to users of statistical information. The brochure is addressed to a wide range of users (international institutions, businessmen, students, experts etc.) and changes the traditional presentation of statistical information by offering an innovative structure with a parallel translation in English. The publication contains topical statistical information about the demographic, social and economic development of the country over the 2003 - 2009 period. It also inc...
Energy Balance Sheets 2008
The annual bilingual publication ‘Energy Balance Sheets 2008’ contains the data for 2003 - 2008 on energy statistics obtained from the current surveys of the National Statistical Institute.
The publication presents also detailed information on:
• Commodity energy balances - coal and coal products, crude oil and oil products, natural gas, renewables, electricity and heat
• Overall energy balance
• Primary energy production...
Bulgaria 2009
The National Statistical Institute presents the bilingual (Bulgarian/English) brochure Bulgaria 2009 to users of statistical information. The brochure is addressed to a wide range of users (international institutions, businessmen, students, experts etc.) and changes the traditional presentation of statistical information by offering an innovative structure with a parallel translation in English. The publication contains topical statistical information about the demographic, social and economic development of the country over the 2003 - 2008 period. It also inc...
Statistical Yearbook 2008
The National Statistical Institute has the pleasure to submit to the attention of national and foreign users of statistical information the 76th edition of the Statistical Yearbook of the Republic of Bulgaria 2008. It provides topical statistical information on the demographic, economic and social development of the country for the 2002 - 2007 period in different territorial and classification aggregations and breakdowns.
According to the Law on Statistics, official source of information in the Republic of Bulgaria is the National Statistical System, wh...
Energy Balances Sheets 2007
The annual bilingual publication ‘Energy Balance Sheets 2007’ contains the data for 2003 - 2007 on energy statistics obtained from the current surveys of the National Statistical Institute.
The publication presents also detailed information on:
• Commodity energy balances - coal and coal products, crude oil and oil products, natural gas, renewables, electricity and heat
• Overall energy balance
• Primary energy production...
Statistical Reference Book of the Republic of Bulgaria 2008
The National Statistical Institute presents to users of statistical information one of its main publications - Statistical Reference Book of the Republic of Bulgaria 2008 in English. It is a concise form of the same issue in Bulgarian.
The Statistical Reference Book presents topical information on the demographic processes as well as the economic, social and cultural development of the Republic of Bulgaria for the 2004 - 2007 period.
The publication presents data on main macroeconomic indicators of the national economy - gross dom...


