
The European Health Interview Survey (EHIS) is conducted in all Member States of the European Union (EU) using a standardised methodology and a harmonised toolkit. Its aim is to assess the health status, lifestyle (health determinants) and use of health care services by EU citizens.
The National Statistical Institute (NSI) carried out the fourth wave of the survey between October 2025 and January 2026, in accordance with the requirements of Regulation (EU) 2019/1700 of the European Parliament and of the Council and the related implementing regulations of the European Commission in the field of health statistics.
Health status
According to preliminary data, in 2025 the highest proportion of people aged 15 and over is those who describe their health as ‘good’ (45.4%), followed by those who described it as ‘fair (23.7%) and ‘very good’ (23.0%). ‘Bad’ and ‘very bad’ were reported by 6.3% and 1.6% of the population, respectively. Compared to 2019, there has been a decrease in the share of people who have a negative self-assessment of their health (Fig. 1).
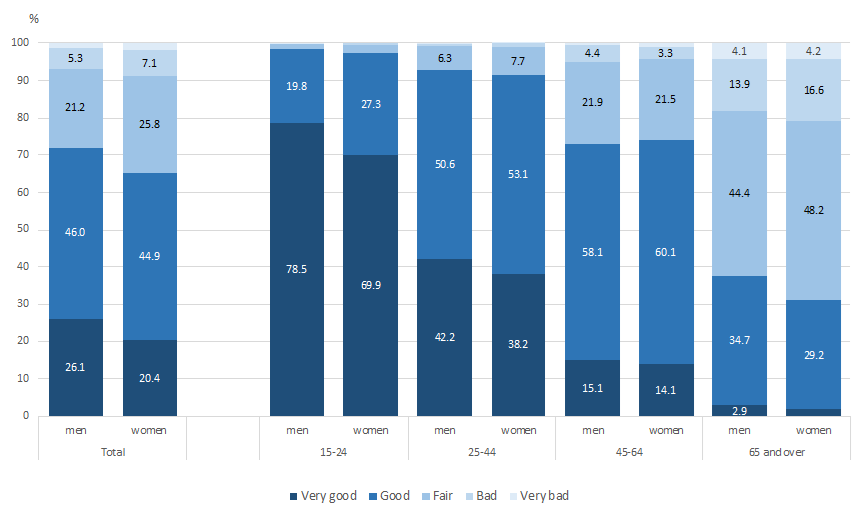
Sex and age are key factors in how people rate their health (Fig. 2). Men are more likely to describe their health as ‘very good’ and ‘good’ (72.1%) compared with women (65.3%). As people get older, the proportion of those who rate their health as ‘fair’, ‘bad’ and ‘very bad’ increases.
Figure 2. Self-perceived health status by sex and age in 2025
Chronic conditions are the main reason for using medical care, and their treatment is, in most cases, costly both for the healthcare system and for the individual. In 2025, 45.8% of people aged 15 and over reported having a chronic condition or health problem, which is more than 5 percentage points higher than the figure reported in 2019 (40.2%).
EHIS explores the prevalence of certain groups of chronic conditions or health problems identified by an international team of experts. When answering the question, respondents should consider whether the condition or health problem has been present during the 12 months preceding the interview. The question asks respondents whether they have a specific chronic condition or health problem, rather than whether they ‘suffer’ from it. In this sense, this also includes cases where the respondent has a condition that is controlled by medication (e.g. high blood pressure) and therefore does not present a problem.
Once again, in 2025, the most common chronic condition in Bulgaria, amongst those included in the questionnaire, was hypertension - affecting 30.7% of people aged over 15. The condition is more prevalent amongst women (32.1%) than amongst men (29.2%) (Table 1).
In second place among the conditions and health problems observed are low back disorder or other chronic back defects, reported by 9.7% of respondents. These are more common among women (10.6%) than among men (8.7%).
Diabetes is one of the diseases of significant social importance, which has a substantial impact on people’s quality of life and often leads to complications. According to preliminary data from the survey conducted in 2025, 8.4% of the population aged 15 and over in Bulgaria have diabetes. The condition is prevalent among 6.9% of men and 9.8% of women.
In 2025, 5.1% of people reported having osteoarthritis, with the condition being significantly more prevalent amongst women - 7.2% than amongst men - 2.8%.
| 1. Prevalence of selected chronic diseases among persons aged 15 and over by diseases and sex, 2025 (%) | |||
|---|---|---|---|
| Diseases and chronic conditions | Total | Male | Female |
| Arthrosis (arthritis excluded) | 5.1 | 2.8 | 7.2 |
| Low back disorder or other chronic back defect | 9.7 | 8.7 | 10.6 |
| Neck disorder or other chronic neck defect | 4.4 | 3.1 | 5.6 |
| Asthma (allergic asthma included) | 2.0 | 1.3 | 2.6 |
| Chronic respiratory diseases (excluding asthma) | 3.0 | 2.7 | 3.2 |
| Myocardial infarction (heart attack) or chronic consequences of myocardial infarction | 1.7 | 2.2 | 1.2 |
| Coronary heart disease or angina pectoris | 6.2 | 6.1 | 6.4 |
| High blood pressure (hypertension) | 30.7 | 29.2 | 32.1 |
| Stroke (cerebral haemorrhage, cerebral thrombosis) or chronic consequences of stroke | 2.1 | 1.9 | 2.2 |
| Urinary incontinence, problems in controlling the bladder | 2.4 | 2.1 | 2.6 |
| Kidney problems | 4.4 | 3.8 | 4.9 |
| Diabetes | 8.4 | 6.9 | 9.8 |
| Allergy (allergic asthma excluded) | 3.9 | 2.8 | 5.0 |
| Depression | 2.0 | 2.1 | 2.7 |
Health care
Surveys of the population’s health status conducted through interviews provide information for characterising individuals who have used health care services according to key socio-demographic characteristics.
Inpatient care
The results show that in 2025, 11.7% of the population aged 15 and over were hospitalised for one or more days1.
In the 12 months prior to the interview, 11.2% of the population aged 15 and over had been admitted to hospital as day patients2.
Outpatient care
The European Health Interview Survey is a source of information on the frequency of consultations with selected medical specialists. Only visits and consultations relating to the respondent’s own health needs are included; visits made whilst accompanying a child, spouse, etc. are not included. Contacts made solely for the purpose of arranging an appointment, or contacts with a nurse on behalf of a general practitioner, are not included.
The data show that, in the 12 months preceding the interview, respondents had consulted:
Timely referral to a general practitioner, a specialist or a dentist is essential to good health, prevention and the avoidance of serious medical complications. Each of these medical specialists plays a key role in the healthcare system. In this regard, it is important to note the positive trend indicated by the survey data when comparing the indicators with those from 2019 (Table 2).
| 2. Consultations with medical specialists among persons aged 15 and over in 2019 and 2025 by sex and age (%) | ||||||
|---|---|---|---|---|---|---|
| Characteristics | General practitioner | Specialists | Dentist or orthodontist | |||
| Year | 2019 | 2025 | 2019 | 2025 | 2019 | 2025 |
| Total | 62.5 | 70.7 | 27.2 | 33.4 | 41.0 | 45.9 |
| By sex | ||||||
| Male | 54.9 | 64.3 | 23.0 | 28.2 | 38.4 | 43.2 |
| Female | 69.5 | 76.5 | 31.1 | 38.0 | 43.4 | 48.4 |
| By age | ||||||
| 15 - 24 | 44.5 | 50.3 | 15.6 | 24.5 | 44.0 | 53.8 |
| 25 - 44 | 47.0 | 56.3 | 23.6 | 31.6 | 46.9 | 54.5 |
| 45 - 64 | 66.8 | 73.4 | 29.3 | 33.7 | 44.8 | 50.1 |
| 65+ | 83.9 | 87.4 | 34.2 | 37.8 | 27.6 | 30.7 |
The breakdown by sex indicates that women are more active when it comes to consulting health care specialists. As people get older, the frequency of visits to GPs and specialists increases. The exception is visits to the dentist in the last 12 months, which decrease significantly after the age of 65.
Use of prescribed and non-prescribed medicines
The use of medicines requires a clear distinction to be made between prescribed and non-prescribed medicines, as taking them incorrectly carries serious health risks.
According to preliminary data from the European Health Interview Survey in 2025, in the two weeks preceding the interview, 46.1% of people aged 15 and over had taken medicines prescribed by a doctor. Compared with previous waves of the survey, there has been an increase in the proportion of people who took both prescribed and non-prescribed medicines, herbal products and vitamins. This increase is particularly significant with regard to the use of medicines without a doctor’s prescription - from 36.5% in 2019 to 45.9% in 2025 (Fig. 3).
Preventive measures
Preventive measures are one of the key factors in improving the health status of the population and reducing mortality from certain diseases. Expanding the scope of preventive activities is important for the timely identification of health problems and for taking the necessary measures to treat them and reduce the risk of developing chronic diseases. In this regard, EHIS includes questions on the implementation of selected preventive measures.
The survey results show that, in 2025, the most widely practised preventive measure among those included in the questionnaire was having one’s blood pressure measured by a healthcare professional. For 62.7% of men and 74.2% of women, it had been measured by a healthcare specialist in the 12 months preceding the interview (Table 3).
| 3. Preventive actions within the past 12 months, by sex (%) | ||||||
| Preventive measures | 2019 | 2025 | ||||
| Total | Male | Female | Total | Male | Female | |
| Blood pressure measurement by a health professional | 61.0 | 54.9 | 66.4 | 68.8 | 62.7 | 74.2 |
| Blood cholesterol measurement | 52.9 | 47.4 | 57.9 | 66.9 | 60.7 | 72.4 |
| Blood sugar measurement | 53.5 | 47.9 | 58.5 | 67.1 | 60.8 | 72.6 |
During this period, 60.8% of men and 72.6% of women had their blood sugar levels checked by a healthcare professional, whilst 60.7% of men and 72.4% of women aged 15 and over had their cholesterol levels checked.
The most widely used screening tool for cervical cancer worldwide is the cervical smear test. Women aged between 20 and 69 are defined as the main target population with the highest risk profile for developing the disease. Preliminary data from the European Health Interview Survey indicate that, for 2025, 29.5% of women in this age group in Bulgaria had their last cervical smear test within the past 12 months (Fig. 4). At the same time, there has been a decrease in the proportion of women who have never had this test. These changes indicate a positive trend in the prevention and early detection of cervical cancer and show an increase in women’s participation in screening tests.
Health determinants (lifestyle)
The purpose of the questions included in this module is to assess health habits as part of individual actions to protect and restore health.
Weight and height, overweight and obesity
Being overweight is one of the negative factors influencing the prevalence of cardiovascular disease, diabetes and other chronic diseases. The information on the height and the weight of persons that is collected by EHIS allows calculating Body Mass Index (BMI)3, which defines the proportion of people with overweight and obesity.
In 2025, 66.1% of men and 45.3% of women aged 18 and over in Bulgaria were overweight, including those who were obese. A comparison of the data with the previous wave of the survey shows that over the last six years the proportion of people who are obese has increased - from 15.6% to 19.6% among men and from 12.0% to 14.4% among women (Table 4).
| 4. Distribution of persons aged 18 and over by BMI and sex in 2019 and 2025 (%) | ||||||
|---|---|---|---|---|---|---|
| BMI | Total | Male | Female | |||
| 2019 | 2025 | 2019 | 2025 | 2019 | 2025 | |
| Underweight (under 18.5) | 2.0 | 2.4 | (0.9) u | (0.6) u | 3.8 | 4.1 |
| Normal weight (18.5 - 24.99) | 43.1 | 42.4 | 36.3 | 33.3 | 51.2 | 50.7 |
| Pre-obese (25.00 - 29.99) | 41.2 | 38.4 | 47.7 | 46.5 | 33.4 | 30.9 |
| Obese (30.00+) | 13.7 | 16.9 | 15.6 | 19.6 | 12.0 | 14.4 |
| u - due to a small sample size, figures in brackets are not reliable. | ||||||
The breakdown of persons by age shows that the highest proportion of those with a BMI ≥ 30.0 is found in the 45 - 64 age group (20.9%), followed by the oldest age group, those aged 65 and over (19.2%). It is noticeable that, apart from the youngest age group, an increase in the proportion of obese persons is observed in all other age groups (Fig. 5).
Smoking
Specialists identify smoking as one of the most significant risk factors for the development of lung diseases, certain cancers and cardiovascular diseases.
According to preliminary data from the European Health Interview Survey, the number of smokers (both daily and occasional smokers)4 aged 15 and over in Bulgaria in 2025 is estimated at 1.85 million people (33.1%). 28.5% of people smoke daily, and 4.6% smoke occasionally (Fig. 6). Compared with 2019, there has been a positive trend towards an increase in the proportion of non-smokers - from 63.8% to 66.9%.
Figure 6. Distribution of persons aged 15 and over by smoking patterns and sex in 2019 and 2025 (%)
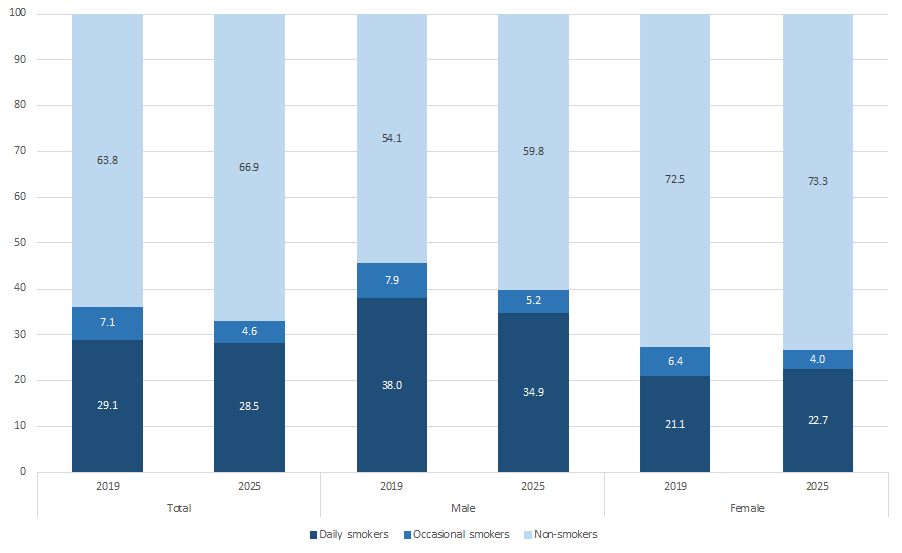
Sex is a key factor in the prevalence of smoking in 2025 - 40.1% of men and 26.7% of women are smokers. However, when comparing these figures with those from 2019, a greater reduction in the proportion of smokers is observed specifically among men. There has also been a decrease in the proportion of men who smoke daily, whilst among women there has been a slight increase in the number of daily smokers.
Smoking is most prevalent in the 45 - 64 age group - 53.3% of men and 40.1% of women in this age group smoke daily or occasionally. This is followed by the 25 - 44 age group, in which 44.0% of men and 31.5 % of women are smokers. Among young people aged 15 - 24, one in five was a smoker in 2025, whilst among the oldest age group, aged 65 and over, 24.7% of men and 13.3% of women were smokers.
Exposure to tobacco smoke indoors is one of the most serious, yet easily preventable, risks to public health in the modern world. According to preliminary data from the European Health Interview Survey, in 2025 one in four people aged 15 and over is exposed to tobacco smoke indoors on a daily basis and 8.8% of people are exposed at least once a week (Fig. 7). It should be noted, however, that compared with 2019, there has been a tendency for these relative proportions to decrease and, correspondingly, an increase in the share of people who are never or almost never exposed to tobacco smoke indoors (45.2% in 2019 and 53.8% in 2025).
Alcohol consumption
Another risk factor with respect to the health status is alcohol consumption.
During the year preceding the survey, 23.3% of men and 48.7% of women aged 15 and over had not consumed alcohol at all (Table 5). 22.4% of men and 17.5% of women drank monthly (once or 2 - 3 days a month).
13.0% of men and 3.3% of women aged 15 and over consumed alcohol every day or almost every day.
| 5. Alcohol consumption among persons aged 15 and over in 2019 and 2025, by sex | ||||||
|---|---|---|---|---|---|---|
| (%) | ||||||
| Frequency | Total | Male | Female | |||
| 2019 | 2025 | 2019 | 2025 | 2019 | 2025 | |
| Every day or almost every day | 10.2 | 7.8 | 17.4 | 13.0 | 3.6 | 3.3 |
| 5 - 6 days a week | 3.3 | 3.3 | 5.7 | 5.4 | (1.1) u | 1.5 |
| 3 - 4 days a week | 10.3 | 7.0 | 15.1 | 10.9 | 5.9 | 3.5 |
| 1 -2 days a week | 10.2 | 8.0 | 13.2 | 11.5 | 7.5 | 4.9 |
| 2 - 3 days a month | 13.0 | 10.9 | 14.6 | 13.6 | 11.6 | 8.4 |
| Once a month | 9.9 | 8.9 | 9.0 | 8.8 | 10.7 | 9.1 |
| Less than once a month | 13.4 | 17.3 | 8.8 | 13.6 | 17.6 | 20.7 |
| Not in the past 12 months, as I no longer drink alcohol | 11.2 | 13.3 | 7.8 | 11.2 | 14.4 | 15.2 |
| Never, or only a few sips or trials, in my whole life | 18.5 | 23.4 | 8.4 | 12.1 | 27.6 | 33.5 |
| u - due to a small sample size, figures in brackets are not reliable. | ||||||
Methodological notes
The European Health Interview Survey is a part of the European Health Survey System, which aims to measure on a harmonized basis and with a high degree of comparability among EU member states, the health status, lifestyle (health determinants) and health care services use of EU citizens.
In 2025, all member states took part in the fourth wave of the survey in accordance with Regulation (EU) 2019/1700 of the European Parliament and of the Council and the related implementing regulations of the European Commission in the field of public health statistics. The National Statistical Institute carried out the survey between October 2025 and January 2026 as part of the ‘European Health Interview Survey (EHIS) 2025’ project, implemented under a grant agreement with the European Commission № 101191410 – 2024-BG-EHIS.
The thematic areas included in the questionnaire are designed to meet basic information needs and they do not cover all aspects of health in detail, which could be achieved through specific studies at national level.
The questionnaire consists of four modules:
According to the character of the questions, the reference period is two or four weeks, six or twelve months. The selection for this observation period was made in such a way as to obtain the most reliable answers possible.
It should be noted that, in order to reduce the burden on respondents, the questionnaire was modified across the four waves of the survey. Consequently, when using and carrying out a comparative analysis of the data, it should be kept in mind that comparability is not complete for some of the indicators, and in some cases does not exist at all.
Two survey methods were used:
- Face-to-face interviews conducted by an interviewer using a tablet (CAPI) and
- Computer-assisted web interviewing (CAWI).
The survey covered a nationally representative sample of 11 200 persons aged 15 and over in 5 610 eligible private households. The survey is conducted on the basis of voluntary participation and the consent of the respondents. A total of 8 557 people were successfully interviewed, with a response rate of 79.9%.
In accordance with the EHIS methodology, people living in institutionalized households, such as residencies for students or workers, medical or social institutions, and prisons, are excluded from the target population.
All the distributions presented are based on the subjective assessment of the respondents. No measurements were taken, nor were any documents required to verify the accuracy of the responses.
In accordance with the methodological recommendations, a proxy interview is allowed only due to health problems of the respondent. There are two possibilities: either the respondent is unable to complete the interview due to physical or mental problems, or the person is hospitalized. When conducting a proxy interview, the requirement is observed that only some of the questions included in the questionnaire - those which the team of international experts has assessed that another person could provide accurate information on - are asked.
Sample selection
A two-stage stratified cluster sample on national and regional levels is used. The sample is stratified by using the administrative regions in the country and persons’ place of residence (town, village). As a result of the stratification, 56 strata are designed. At the first stage, clusters are selected with a probability proportional to their size, separately for 28 districts and for urban and village population. At the second stage, through a systematic selection, 6 households are identified. All persons aged 15 and over in selected households were interviewed.
| 6. The statistical accuracy of the results of some basic indicators (%) | |||||
|---|---|---|---|---|---|
| Indicator/ variable(s) from which the indicator is derived | Number of respondents - n (unweighted) | Estimated proportion - p (weighted) | Standard error - SE | Confidence interval 95% lower limit, in % | Confidence interval 95% upper limit, in % |
| Respondents aged 15 years or over in good or very good health (HS1) | 5210 | 68.5 | 0.7 | 67.0 | 69.9 |
| Respondents aged 15 and over who have a long-term (chronic) illness or health problem (HS2) | 4128 | 54.8 | 0.7 | 44.4 | 47.2 |
| Respondents aged 15 years or over that were severely limited in activities people usually do because of health problems for at least the past 6 months (HS3) | 395 | 4.3 | 0.2 | 3.9 | 4.8 |
| Respondents aged 15 and over who have been hospitalised for one or more full days in the last 12 months (HO12) | 1043 | 11.7 | 0.4 | 11.0 | 12.5 |
| Respondents aged 18 and over who have obesity (BMI > = 30) | 1425 | 16.3 | 0.5 | 15.4 | 17.3 |
As part of the project, a quality report is also to be prepared.
Additional statistical information and data about the survey ‘European Health Interview Survey 2025’ will also be available on request after the completion of the validation process by Eurostat and the publication of the final data in 2027.
1 In accordance with the survey methodology, hospitalisations related to childbirth are excluded, unless there are complications. Cases where a family member is accompanying another sick family member, such as a child, are also excluded.
2 A day patient is a person who has been admitted for hospital treatment (their paperwork has been completed) and is discharged from the hospital on the same day, for example, to have a medical procedure such as chemotherapy, dialysis, etc.
3 BMI is defined as the weight in kilos divided by the square of the height in meters. Persons are overweight if the BMI is equal to or greater than 25. Overweight includes obesity (BMI is equal to or greater than 30). For international comparisons, the indicator is calculated for persons aged 18 and over.
4 This refers to all types of tobacco products - cigarettes, cigars and pipes. E-cigarettes and electronic tobacco heating devices (e.g. IQOS, GLO, etc.) are excluded.


Copyright © 2026 NSI All rights reserved