
LIFE EXPECTANCY AT BIRTH IN THE PERIOD 2023 - 2025
Life expectancy at birth[1] of the Bulgarian population, calculated for the period 2023 - 2025, was 75.9 years. Compared to the previous period (2022 - 2024), it increased by 0.3 years.
Different mortality rates among males and females, as well as among urban and rural populations, resulted in differences in the life expectancy at birth for these population categories.
Life expectancy at birth for the male population is 72.2 years, while for the female population it is by 7.4 years higher - 79.6 years.
Compared to 2015, in 2025, the life expectancy at birth increased by 1.1 years for the male population, while for the female population it increased by 1.6 years.
Life expectancy of the urban population (76.7 years) is 2.9 years higher than that of the rural (73.8 years). Compared to 2024, an increase of 0.3 years is observed for both urban and rural population.
Life expectancy at the age of 65 is 17.0 years. The respective values for males and females are 14.7 and 18.8 years. Compared to 2024, in 2025, the life expectancy at the age of 65 increased by 0.3 years.
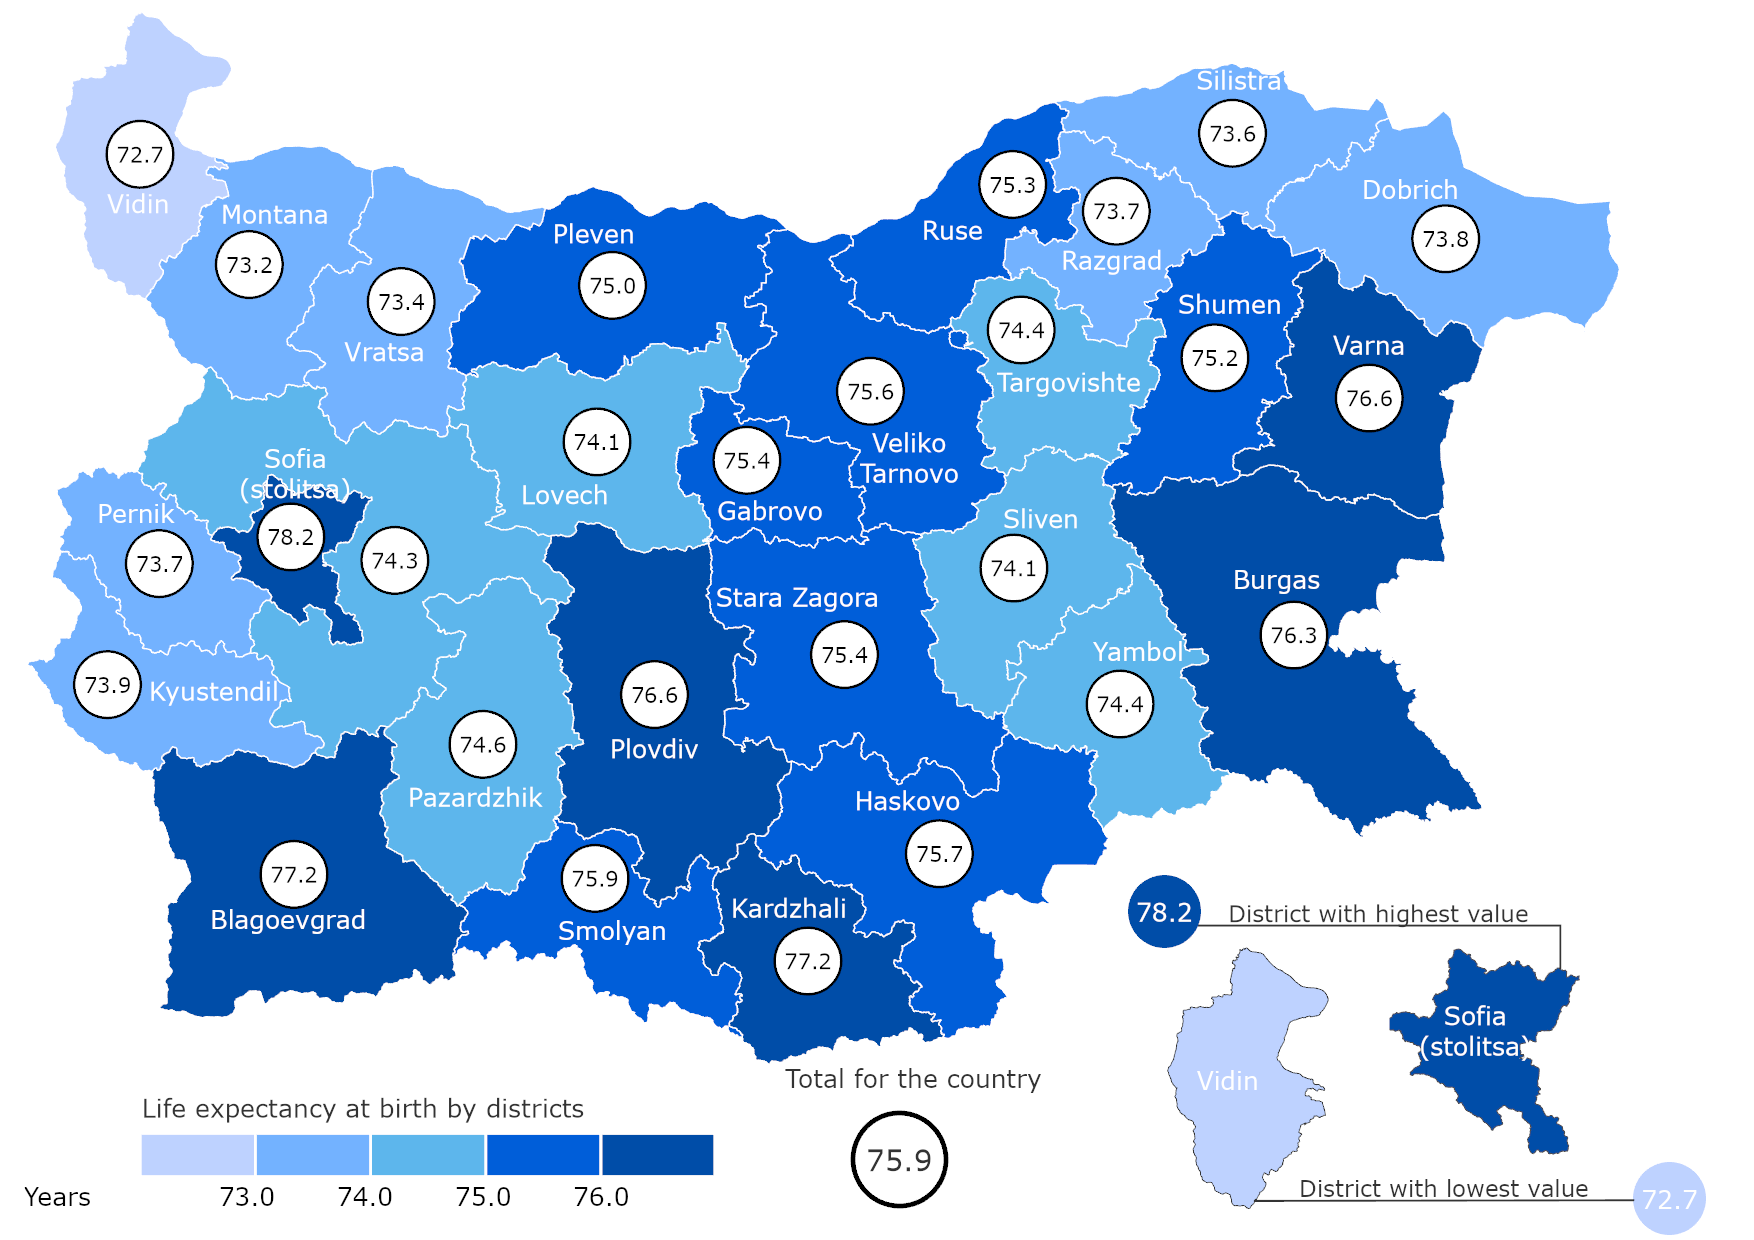
Life expectancy at birth varies from 72.7 years in Vidin district to 78.2 years in Sofia (stolitsa) district. Women live longer than men in all districts in the country, but the highest is the difference between the sexes in Vidin district (8.9 years), while the smallest is in the district Kardzhali (5.9 years).
Figure 2. Life expectancy at birth by district
Methodological notes
Life tables (biometric tables) are used for examining the age-specific mortality. They indicate the order of dying of a generation and reflect the gradual decrease of this generation due to the mortality. The life tables contain a system of age-specific coefficients (presented as a function of the age) measuring the level of mortality during the separate time periods, survivors to a given age, life expectancy, etc.
Life tables and life expectancy are calculated from data for dead persons by single ages and years of birth, population by single ages and live births for three consecutive years.
The life expectancy indicator, calculated by the data from the life tables, measures the expected (probable) quantity of years (or number of years), which is the forthcoming average to survive a person at age x (persons at every age) if during all his life the intensity of the mortality will be the same as the one during the current period.
Life expectancy at birth - represents the ratio between the sum of men-years, which the persons who have reached a given age x will survive for the whole period of their future life (from age x to the upper limit age) and the number of persons who have survived the age x.
[1] Life expectancy at birth indicates the average expected duration of the life of a newborn under the hypothesis of a constant intensity of the age-specific mortality observed for the respective year. Detailed information on life expectancy at birth by age is published on the NSI website, heading ‘Population and demographic processes’, theme ‘Life tables’.


Copyright © 2026 NSI All rights reserved