Statistical Yearbook 2017 in infographics
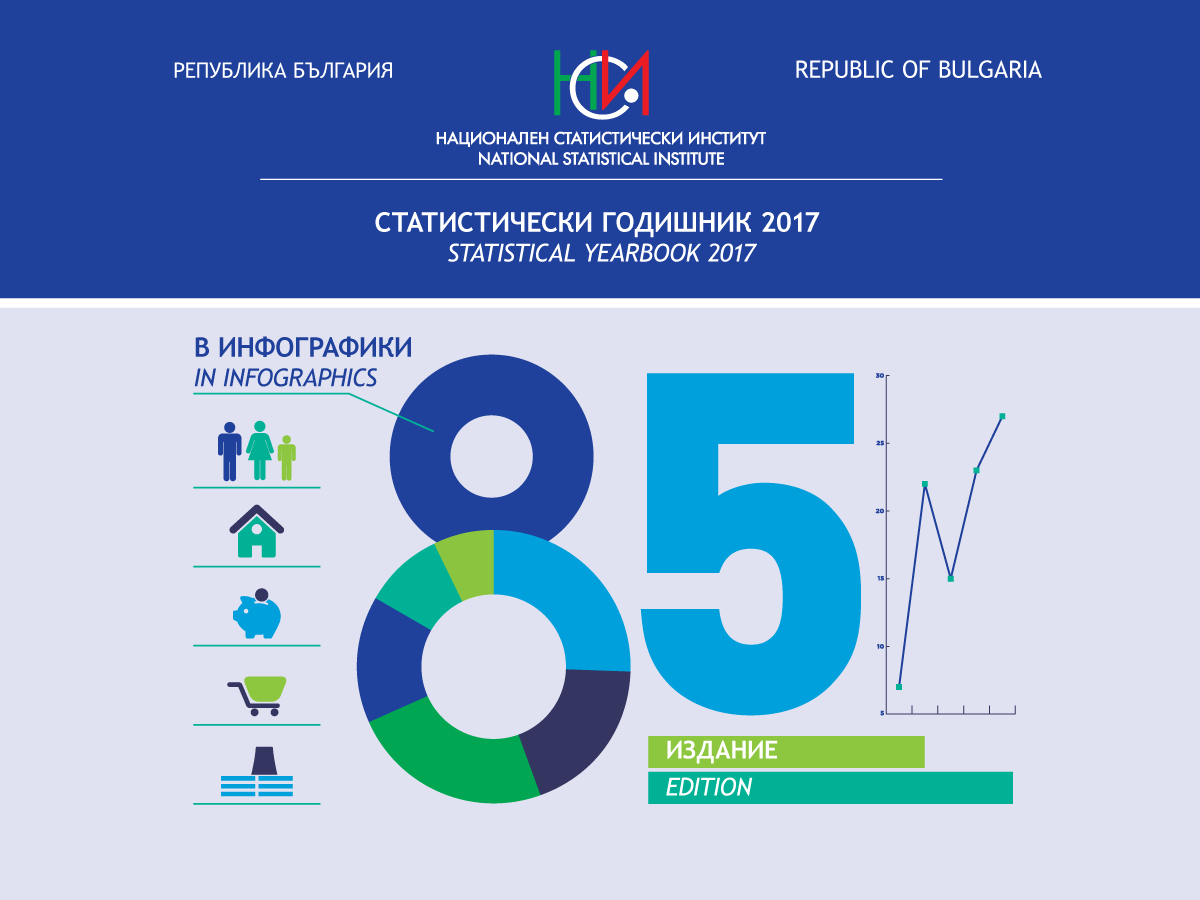
The National Statistical Institute of Bulgaria offers a different view of the statistical information included in the 85th edition of the Statistical Yearbook of the Republic of Bulgaria.
The publication is intended for a wider audience as statistical data are presented in a plain and easy understandable way.
The current state and changes in the socio-economic and cultural life in the country are presented not in the traditional way in tables and text, but through infographics - images, graphics and other visualization tools.