Macroeconomic statistics
- Gross Domestic Product (GDP)
- Gross National Income (GNI)
- Government Finance Statistics
- Employment and Hours worked - total of the economy
- Employment and Hours worked - by Regions
- Inflation and Consumer Price Indices
- Purchasing Power Parities (PPPs) - European and International Comparisons Programme
- Non-financial national accounts by institutional sectors
- Housing price statistics
- Supply Use Tables
- Financial national accounts
- National accounts - quality reports for the ESA 2010 Data Transmission Programme
- Pension entitlements in social insurance
- Gross Domestic Product (GDP)
- Gross Domestic Product (GDP) - ESA 2010
- Annual data
- Quarterly data
- Quarterly data - flash estimates
- GDP by Production approach and by Final Expenditure
- Quarterly seasonally adjusted data
- GDP by Production approach, basic data – Total of economy
- GDP by Production approach, detailed data – Total of economy
- GDP by Final Expenditure, basic data – Total of economy
- GDP by Final Expenditure, detailed data – Total of economy
- Gross Domestic Product (GDP) - ESA 2010
- Gross National Income (GNI)
- Gross National Income (GNI)
- Government Finance Statistics
- Annual accounts of General Government
- Non-financial accounts of sector General Government
- Sector General Government
- Sub-sector Central Government
- Sub-sector Local Government
- Sub-sector Social Security Funds
- General government expenditure by function (COFOG)
- Sector General Government
- Sub-sector Central Government
- Sub-sector Local Government
- Sub-sector Social Security Funds
- Taxes and social contributions by type and sub-sectors of General Government
- Sector General Government
- Sub-sector Central Government
- Sub-sector Local Government
- Sub-sector Social Security Funds
- Non-financial accounts of sector General Government
- Government deficit/surplus and debt levels
- Government deficit/surplus and debt levels by sub-sectors of General Government
- Quarterly Non-Financial Accounts of General Government
- Quarterly Non-Financial Accounts of General Government
- Fiscal data on deficit / surplus under Directive EU 85/2011
- Monthly fiscal data
- Quarterly fiscal data
- Annual data on non-performing loans
- Annual data on liabilities of public corporations
- Annual data on participation of government in the capital of corporations
- Annual data on Public-Private Partnerships
- Guaranteed Debt of “General Government” Institutional Sector
- Annual accounts of General Government
- Employment and Hours worked - total of the economy
- Employed persons, hours worked and labour productivity - ESA 2010
- Employment and Hours worked - by Regions
- Employed persons, hours worked and labour productivity
- Annual data
- Employed persons, hours worked and labour productivity
- Inflation and Consumer Price Indices
- Consumer Price Indices (CPI)
- CPI, 1995 = 100
- CPI, previous month = 100
- CPI, December of the previous year = 100
- CPI, corresponding month of the previous year = 100
- Annual average CPI, previous 12 months = 100
- Annual average CPI, previous year = 100
- Harmonized Indices of Consumer Prices (HICP)
- HICP, 2015 = 100
- HICP, previous month = 100
- HICP, December of the previous year = 100
- HICP, corresponding month of the previous year = 100
- Annual average HICP, previous 12 months = 100
- Price Indices of a Small Basket (PISB)
- PISB, previous month = 100
- PISB, December of the previous year = 100
- Inflation Rate Calculator
- Inflation Rate Calculator
- Consumer Price Indices (CPI)
- Purchasing Power Parities (PPPs) - European and International Comparisons Programme
- Eurostat – flash estimate
- Purchasing power parities
- Price level indices
- Volume indices of real expenditure of GDP
- Eurostat – nowcast
- Volume Indices of GDP and Actual Individual Consumption per capita in PPS
- Price level index for main groups of consumer goods and services
- Price level indices for consumer goods and services
- Price level indices of GDP and Actual individual consumption
- Purchasing Power Parities
- Purchasing Power Parities – Gross Domestic Product (GDP)
- Purchasing Power Parities – Actual Individual Consumption (AIC)
- Price level indices
- GDP
- Final consumption expenditure of households
- Actual Individual Consumption
- Gross fixed capital fomation
- GDP at Market prices per inhabitant in Euro and in PPS
- GDP at Market Prices per inhabitant in Euro
- GDP at Market Prices per inhabitant in Purchasing Power Standards (PPS)
- Volume indices per capita in PPS
- GDP
- Final consumption expenditure of households
- Actual Individual Consumption
- Gross fixed capital fomation
- Pure survey results
- Food, beverages, tobacco - comparative price levels
- Gross fixed capital formation - comparative price levels
- OECD – international comparisons – results
- Nominal expenditure in US dollars (millions)
- Nominal expenditure per capita in US dollars
- Purchasing Power Parities (OECD=1.00)
- Real expenditure per head in PPPs (US dollars)
- Price level indices (OECD=100)
- Volume indices of real expenditure per capita (OECD=100)
- International Comparisons Program
- Purchasing Power Parities, 2017 – (USD = 1)
- Real Expenditures, 2017 – ($PPPs)
- Real Expenditures per capita, 2017 ($PPPs)
- Volume indices per capita
- Volume indices per capita $PPPs, 2017 (world = 100)
- Volume indices per capita, PPS, (ЕU28=100), 2017
- Price level Indices
- Price level Indices, $PPPs, 2017 (world = 100)
- Comparative Price level Indices, PPS (ЕU28=100), 2017
- Eurostat – flash estimate
- Non-financial national accounts by institutional sectors
- Housing price statistics
- House price indices (HPI)
- House price indices (HPI), national level
- HPI, national level, 2015 = 100
- HPI, national level, previous quarter = 100
- HPI, national level, corresponding quarter of the previous year = 100
- House price indices (HPI), by regions
- HPI, by statistical regions, 2015 = 100
- HPI, by statistical regions, previous quarter = 100
- HPI, by statistical regions, corresponding quarter of the previous year = 100
- HPI, for the six cities with population more than 120 000 inhabitants, 2015 = 100
- HPI, for the six cities with population more than 120 000 inhabitants, previous quarter = 100
- HPI, for the six cities with population more than 120 000 inhabitants, corresponding quarter of the previous year = 100
- House price indices (HPI), national level
- House sales indicators (HSI)
- House sales indicators (HSI) of value of transactions, national level
- HSI of value of transactions, national level - previous quarter = 100
- HSI of value of transactions, national level - corresponding quarter of the previous year = 100
- HSI of value of transactions, national level - percentage in the year
- House sales indicators (HSI) of value of transactions by regions
- HSI of value of transactions by statistical regions - previous quarter = 100
- HSI of value of transactions by statistical regions - corresponding quarter of the previous year = 100
- HSI of value of transactions by statistical regions - percentage in the year
- HSI of value of transactions for the six cities with population more than 120 000 inhabitants - previous quarter = 100
- HSI of value of transactions for the six cities with population more than 120 000 inhabitants - corresponding quarter of the previous year = 100
- HSI of value of transactions for the six cities with population more than 120 000 inhabitants - percentage in the year
- House sales indicators (HSI) of number of transactions, national level
- HSI of number of transactions, national level - previous quarter = 100
- HSI of number of transactions, national level - corresponding quarter of the previous year = 100
- HSI of number of transactions, national level - percentage in the year
- House sales indicators (HSI) of number of transactions by regions
- HSI of number of transactions by statistical regions - previous quarter = 100
- HSI of number of transactions by statistical regions - corresponding quarter of the previous year = 100
- HSI of number of transactions by statistical regions - percentage in the year
- HSI of number of transactions for the six cities with population more than 120 000 inhabitants - previous quarter = 100
- HSI of number of transactions for the six cities with population more than 120 000 inhabitants - corresponding quarter of the previous year = 100
- HSI of number of transactions for the six cities with population more than 120 000 inhabitants - percentage in the year
- House sales indicators (HSI) of value of transactions, national level
- Owner-occupied housing price index (OOHPI)
- OOHPI, national level, 2015 = 100
- OOHPI, national level, previous quarter = 100
- OOHPI, national level, corresponding quarter of the previous year = 100
- Market prices of dwellings
- House price indices (HPI)
- Supply Use Tables
- Annual data
- ESA 2010
- ESA 1995
- NACE rev.1 / CPA
- NACE rev.2 / CPA 2008
- Annual data
- Financial national accounts
- Annual Financial Accounts
- Balance sheets for financial assets and liabilities (stocks)
- Financial accounts by sector (transactions)
- Annual Financial Accounts
- Pension entitlements in social insurance
- Gross Domestic Product (GDP)
- Gross Domestic Product (GDP) - ESA 2010
- Annual data
- Quarterly data
- Quarterly data - flash estimates
- GDP by Production approach and by Final Expenditure
- Quarterly seasonally adjusted data
- GDP by Production approach, basic data – Total of economy
- GDP by Production approach, detailed data – Total of economy
- GDP by Final Expenditure, basic data – Total of economy
- GDP by Final Expenditure, detailed data – Total of economy
- Gross Domestic Product (GDP) - ESA 2010
- Employment and Hours worked - total of the economy
- Employed persons, hours worked and labour productivity - ESA 2010
- Employment and Hours worked - by Regions
- Employed persons, hours worked and labour productivity
- Annual data
- Employed persons, hours worked and labour productivity
- Inflation and Consumer Price Indices
- Consumer Price Indices (CPI)
- CPI, 1995 = 100
- CPI, previous month = 100
- CPI, December of the previous year = 100
- CPI, corresponding month of the previous year = 100
- Annual average CPI, previous 12 months = 100
- Annual average CPI, previous year = 100
- Harmonized Indices of Consumer Prices (HICP)
- HICP, 2015 = 100
- HICP, previous month = 100
- HICP, December of the previous year = 100
- HICP, corresponding month of the previous year = 100
- Annual average HICP, previous 12 months = 100
- Price Indices of a Small Basket (PISB)
- PISB, previous month = 100
- PISB, December of the previous year = 100
- Inflation Rate Calculator
- Inflation Rate Calculator
- Consumer Price Indices (CPI)
- Non-financial national accounts by institutional sectors
- Housing price statistics
- House price indices (HPI)
- House price indices (HPI), national level
- HPI, national level, 2015 = 100
- HPI, national level, previous quarter = 100
- HPI, national level, corresponding quarter of the previous year = 100
- House price indices (HPI), by regions
- HPI, by statistical regions, 2015 = 100
- HPI, by statistical regions, previous quarter = 100
- HPI, by statistical regions, corresponding quarter of the previous year = 100
- HPI, for the six cities with population more than 120 000 inhabitants, 2015 = 100
- HPI, for the six cities with population more than 120 000 inhabitants, previous quarter = 100
- HPI, for the six cities with population more than 120 000 inhabitants, corresponding quarter of the previous year = 100
- House price indices (HPI), national level
- House sales indicators (HSI)
- House sales indicators (HSI) of value of transactions, national level
- HSI of value of transactions, national level - previous quarter = 100
- HSI of value of transactions, national level - corresponding quarter of the previous year = 100
- HSI of value of transactions, national level - percentage in the year
- House sales indicators (HSI) of value of transactions by regions
- HSI of value of transactions by statistical regions - previous quarter = 100
- HSI of value of transactions by statistical regions - corresponding quarter of the previous year = 100
- HSI of value of transactions by statistical regions - percentage in the year
- HSI of value of transactions for the six cities with population more than 120 000 inhabitants - previous quarter = 100
- HSI of value of transactions for the six cities with population more than 120 000 inhabitants - corresponding quarter of the previous year = 100
- HSI of value of transactions for the six cities with population more than 120 000 inhabitants - percentage in the year
- House sales indicators (HSI) of number of transactions, national level
- HSI of number of transactions, national level - previous quarter = 100
- HSI of number of transactions, national level - corresponding quarter of the previous year = 100
- HSI of number of transactions, national level - percentage in the year
- House sales indicators (HSI) of number of transactions by regions
- HSI of number of transactions by statistical regions - previous quarter = 100
- HSI of number of transactions by statistical regions - corresponding quarter of the previous year = 100
- HSI of number of transactions by statistical regions - percentage in the year
- HSI of number of transactions for the six cities with population more than 120 000 inhabitants - previous quarter = 100
- HSI of number of transactions for the six cities with population more than 120 000 inhabitants - corresponding quarter of the previous year = 100
- HSI of number of transactions for the six cities with population more than 120 000 inhabitants - percentage in the year
- House sales indicators (HSI) of value of transactions, national level
- Owner-occupied housing price index (OOHPI)
- OOHPI, national level, 2015 = 100
- OOHPI, national level, previous quarter = 100
- OOHPI, national level, corresponding quarter of the previous year = 100
- Market prices of dwellings
- House price indices (HPI)
- Supply Use Tables
- Annual data
- ESA 2010
- ESA 1995
- NACE rev.1 / CPA
- NACE rev.2 / CPA 2008
- Annual data
- National accounts - quality reports for the ESA 2010 Data Transmission Programme
Bulgaria and EU: Deficit and debt of General Government Institutional Sector for 2023
In 2023, the government deficit and debt of the EU increased in relative terms compared to 2022. In the EU, the government deficit to GDP ratio increased from -3.4% in 2022 to -3.5% in 2023. The government debt to GDP ratio in the EU decreased from 83.4% in 2022 to 81.7% at the end of 2023.
...Deficit and Debt of General Government Sector in the Republic of Bulgaria in 2023 (preliminary data)
In 2023, the General Government Institutional Sector reported a deficit of -3 454 million BGN, or 1.9% of GDP, according to preliminary data from the National Statistical Institute.
The Government Debt of Bulgaria for 2023 is 42 383 million BGN, or 23.1% of GDP.
...Inflation and Consumer Price Indices in March 2024
In March 2024, the monthly inflation rate, measured by the Consumer Price Index (CPI), was 0.2% compared to the previous month, and the annual inflation rate in March 2024 compared to March 2023 was 3.0%.
In March 2024, compared to the previous month, the highest increase was registered for Recreation and culture (+0.9%), Communications (+0.9%) and Transport (+0.8%). The decrease was recorded in the prices for Clothing and footwear (-0.6%), Housing, water, electricity, gas and other fuels (-0.5%) and Food and non-alcoholic beverages (-0.1%).
The monthly ...
Purchasing power parities and GDP per capita in 2023 - flash estimate
In 2023, Luxembourg and Ireland recorded the highest level of GDP per capita in the EU, at 140% and 112% above the EU average. Bulgaria was the Member State with the lowest GDP per capita, at 36% below the EU average.
...Inflation and Consumer Price Indices in February 2024
In February 2024, the monthly inflation rate, measured by the Consumer Price Index (CPI), was 0.3% compared to the previous month, and the annual inflation rate in February 2024 compared to February 2023 was 3.3%.
The highest increase was registered for Transport (+1.5%), Restaurants and hotels (+0.9%), Alcoholic beverages and tobacco (+0.8%) and Food and non-alcoholic beverages (+0.6%). The decrease was recorded in the prices for Clothing and footwear (-2.5%), Furnishings, household equipment and routine maintenance of the house (-0.6%) and Housing, water, electr...
Gross Domestic Product for the Fourth Quarter of 2023 and 2023 (preliminary data)
Fourth quarter of 2023
In the fourth quarter of 2023, Gross Domestic Product (GDP) grew by 1.6% compared to the fourth quarter of 2022 and there is an increase of 0.5% compared to the third quarter of 2023 at seasonally adjusted data
2023 - Annual data
In 2023, GDP at current prices, calculated as a sum of the quarters, is 183 743.4 million BGN. Preliminary data show an increase of GDP for 2023 in real terms by 1.8% compared to 2022.
...Labor productivity, persons employed and hours worked for 2023 (preliminary data)
According to the preliminary data, GDP per person employed increased in real terms by 0.9% in 2023 compared to 2022.
...Labor productivity, persons employed and hours worked for the Fourth Quarter of 2023
According to the preliminary data, GDP per person employed increased in real terms by 0.7% in the fourth quarter of 2023 compared to the same quarter of the previous year.
...Inflation and Consumer Price Indices in January 2024
According to the preliminary data of the NSI, in January 2024, the monthly inflation rate, measured by the Consumer Price Index (CPI), was 0.5% compared to the previous month, and the annual inflation rate in January 2024 compared to January 2023 was 3.8%.
The highest increase was registered for Housing, water, electricity, gas and other fuels (+2.2%), Food and non-alcoholic beverages (+1.0%), Education (+0.8%) and Health (+0.6%). The decrease was recorded in the prices for Clothing and footwear (-3.5%) and Transport (-1.7%).
According to the preliminary...
Gross Domestic Product for the Fourth Quarter of 2023 (Flash Estimates)
According to the seasonally adjusted data, GDP had a growth rate of 1.6% in the fourth quarter of 2023 compared to the same quarter of the previous year.
...Inflation and Consumer Price Indices in December 2023
In December 2023, the monthly inflation rate, measured by the Consumer Price Index (CPI), was 0.3% compared to the previous month, and the annual inflation rate in December 2023 compared to December 2022 was 4.7%.
The highest increase was registered for Recreation and culture (+2.4%), Restaurants and hotels (+0.7%), Miscellaneous goods and services (+0.7%) and Food and non-alcoholic beverages (+0.7%). The decrease was recorded in the prices for Transport (-1.5%), Clothing and footwear (-0.6%) and Communications (-0.3%).
The monthly inflation rate, measur...
Inflation and consumer price indices in November 2023
In November 2023, the monthly inflation rate, measured by the Consumer Price Index (CPI), was 0.3% compared to the previous month, and the annual inflation rate in November 2023 compared to November 2022 was 5.4%.
An increase was registered for Housing, water, electricity, gas and other fuels (+1.4%), Recreation and culture (+1.4%), Restaurants and hotels (+0.7%), Health (+0.4%). The highest decrease was recorded in the prices for Clothing and footwear (-0.9%), Transport (-0.6%), Furnishings, household equipment and routine maintenance of the house (-0.2%).
...Consumption per capita in purchasing power standards in 2022
Consumption per capita varied between 69% and 138% of the EU average. Between 2020 and 2022, Actual Individual Consumption (AIC) levels increased in 18 EU countries, most notably in Bulgaria (from 60% in 2020 to 69% in 2022 of the EU average).
...Labor productivity, persons employed and hours worked for the Third Quarter of 2023
According to the preliminary data, GDP per person employed increased in real terms by 2.1% in the third quarter of 2023 compared to the same quarter of the previous year.
...Gross Domestic Product for the Third Quarter of 2023 (preliminary data)
In the third quarter of 2023, Gross Domestic Product (GDP) grew by 1.8% and Gross Value Added (GVA) - by 0.9% compared to the third quarter of 2022 (data are preliminary and seasonally adjusted).
The increase in Gross Value Added is determined by the growth in the following economic activities:
Mining and quarrying; manufacturing; electricity, gas, steam and air conditioning supply; water supply, waste management and remediation activities - 2.9%, Wholesale and retail trade; repair of motor vehicles and motorcycles; transportation and storage; accommodation and...
Inflation and consumer price indices in October 2023
In October 2023, the monthly inflation rate, measured by the Consumer Price Index (CPI) was 0.4% compared to the previous month, and the annual inflation rate in October 2023 compared to October 2022 was 5.8%.
An increase was registered for Recreation and culture (+6.7%), Clothing and footwear (+5.7%), Education (+1.1%) and Furnishings, household equipment and routine maintenance of the house (+0.8%). The highest decrease was recorded in the prices for Housing, water, electricity, gas and other fuels (-0.4%), Food and non-alcoholic beverages (-0.4%) and Transport ...
Gross Domestic Product for the Third Quarter of 2023 (Flash Estimates)
According to the seasonally adjusted data, GDP had a growth rate of 1.7% in the third quarter of 2023 compared to the same quarter of the previous year.
...Bulgaria and EU: Deficit and debt of General Government Institutional Sector for 2022
In 2022, the government deficit and debt of the EU decreased in relative terms compared with 2021. In the EU, the government deficit to GDP ratio shrunk from -4.7% in 2021 to -3.3% in 2022. The government debt to GDP ratio in the EU decreased from 87.4% in 2021 to 83.5% at the end of 2022.
...Deficit and Debt of General Government Sector in the Republic of Bulgaria in 2022 (final data)
According to final data from the National Statistical Institute, the General Government Institutional Sector reported in 2022 a deficit of 4 859 million BGN, or 2.9% of GDP.
The Government Debt of Bulgaria for 2022 is 37 850 million BGN, or 22.6% of GDP.
...Labor productivity, persons employed and hours worked for 2022 (updated annual data)
According to the updated annual data, GDP per person employed increased in real terms by 4.3% in 2022 compared to 2021.
...Gross Domestic Product for 2022 (updated annual data)
In 2022, GDP at current prices is 167 809 million BGN. Updated annual data show an increase of GDP for 2022 in real terms by 3.9% compared to 2021.
...Inflation and consumer price indices in September 2023
In September 2023, the monthly inflation rate, measured by the Consumer Price Index (CPI), was -0.1% compared to the previous month, and the annual inflation rate in September 2023 compared to September 2022 was 6.3%.
In September 2023, compared to the previous month, a decrease was registered for Recreation and culture (-10.1%) and Restaurants and hotels (-1.9%). The highest increase was recorded in the prices for Education (+4.0), Transport (+2.7%), Clothing and footwear (+0.6%), Health (+0.6%) and Food and non-alcoholic beverages (+0.5%).
In September...
Inflation and consumer price indices in August 2023
In August 2023, the monthly inflation rate, measured by the Consumer Price Index (CPI), was 0.4% compared to the previous month, and the annual inflation rate in August 2023 compared to August 2022 was 7.7%.
In August 2023, compared to the previous month, the highest increase was recorded in the prices for Transport (+4.6%), Health (+0.6%), Restaurants and hotels (+0.6%) and Miscellaneous goods and services (+0.4%). The decrease was registered for Clothing and footwear (-2.3%), Communications (-0.6%) and Housing, water, electricity, gas and other fuels (-0.3%)....
Labor productivity, persons employed and hours worked for the Second Quarter of 2023
In the second quarter of 2023 GDP per person employed increased in real terms by 1.7% compared to the second quarter of 2022, аccording to the preliminary data.
...Gross Domestic Product for the Second Quarter of 2023 (preliminary data)
In the second quarter of 2023, Gross Domestic Product (GDP) grew by 1.9% and Gross Value Added (GVA) by 2.2% compared to the second quarter of 2022 (data are preliminary and seasonally adjusted).
The increase in Gross Value Added is determined by the growth in the following economic activities:
Construction - 5.8%, Wholesale and retail trade; repair of motor vehicles and motorcycles; transportation and storage; accommodation and food service activities - 4.6%, Professional, scientific and technical activities; administrative and support service activities - 4.4%, Agricul...
Inflation and consumer price indices in July 2023
In July 2023, the monthly inflation rate, measured by the Consumer Price Index (CPI), was 0.9% compared to the previous month, and the annual inflation rate in July 2023 compared to July 2022 was 8.5%.
In July 2023, compared to the previous month, the highest increase was recorded in the prices for Recreation and culture (+7.5%), Restaurants and hotels (+2.9%), Housing, water, electricity, gas and other fuels (+1.8%) and Health (+0.7%). The decrease was registered for Clothing and footwear (-1.4%) and Miscellaneous goods and services (-0.1%).
In July 202...
Gross Domestic Product for the Second Quarter of 2023 (Flash Estimates)
According to the seasonally adjusted data, GDP had a growth rate of 1.8% in the second quarter of 2023 compared to the same quarter of the previous year.
...Inflation and consumer price indices in June 2023
In June 2023, the monthly inflation rate, measured by the Consumer Price Index (CPI), was -0.4% compared to the previous month, and the annual inflation rate in June 2023 compared to June 2022 was 8.7%.
In June 2023, compared to the previous month, the highest decrease was recorded in the prices for Recreation and culture (-3.1%), Food and non-alcoholic beverages (-1.0%), Housing, water, electricity, gas and other fuels (-0.6%) and Clothing and footwear (-0.6%). The highest increase was registered for Restaurants and hotels (+1.6%), Communications (+1.1%) and Heal...
Household consumption: price levels in 2022
In 2022, price levels for household final consumption expenditure differed widely across the EU.
The highest price levels were recorded in Ireland (146% of the EU average), Denmark (145%) and Luxembourg (137%). Meanwhile, the lowest levels were recorded in Romania (58%), Bulgaria (59%) and Poland (62%).
...Actual individual consumption per capita in 2022
Inflation and consumer price indices in May 2023
In May 2023, the monthly inflation rate, measured by the Consumer Price Index (CPI), was -0.1% compared to the previous month, and the annual inflation rate in May 2023 compared to May 2022 was 10.1%.
In May 2023, compared to the previous month, the highest decrease was recorded in the prices for Recreation and culture (-3.4%), Transport (-2.5%) and Housing, water, electricity, gas and other fuels (-0.4%). The highest increase was registered for Alcoholic beverages and tobacco (+1.1%), Clothing and footwear (+1.0%), Miscellaneous goods and services (+0.5%), Health...
Gross Domestic Product for the First Quarter of 2023 (preliminary data)
In the first quarter of 2023, Gross Domestic Product (GDP) grew by 2.3% and Gross Value Added (GVA) by 2.7% compared to the first quarter of 2022 (data are preliminary and seasonally adjusted).
The increase in Gross Value Added is determined by the growth in the following economic activities:
Construction - 7.0%, Wholesale and retail trade; repair of motor vehicles and motorcycles; transportation and storage; accommodation and food service activities - 5.9%, Information and communication - 3.2%, Real estate activities - 3.2%, Public administration and defence; compulsory...
Labor productivity, persons employed and hours worked for the First Quarter of 2023
According to the preliminary data, GDP per person employed increased in real terms by 0.3% in the first quarter of 2023 compared to the first quarter of 2022.
...Gross Domestic Product for the First Quarter of 2023 (Flash Estimates)
According to the seasonally adjusted data, GDP had a growth rate of 2.0% in the first quarter of 2023 compared to the same quarter of the previous year.
...Inflation and consumer price indices in April 2023
In April 2023, the monthly inflation rate, measured by the Consumer Price Index (CPI), was 0.3% compared to the previous month, and the annual inflation rate in April 2023 compared to April 2022 was 11.6%.
In April 2023, compared to the previous month, the highest price increase was registered for Clothing and footwear (+5.4%), Miscellaneous goods and services (+1.0%), Restaurants and hotels (+1.0%), Furnishings, household equipment and routine maintenance of the house (+0.9%) and Alcoholic beverages and tobacco (+0.8%). The decrease was recorded in the prices for...
Bulgaria and EU: Deficit and debt of General Government Institutional Sector for 2022 (preliminary data)
In 2022, the government deficit and debt of the EU decreased in relative terms compared with 2021. In the EU, the government deficit to GDP ratio shrank from -4.8% in 2021 to -3.4% in 2022. The government debt to GDP ratio in the EU decreased from 88.0% in 2021 to 84.0% at the end of 2022.
...Deficit and Debt of General Government Sector in the Republic of Bulgaria in 2022 (preliminary data)
In 2022, the General Government Institutional Sector reported a deficit of -4 648 million BGN, or 2.8% of GDP, according to preliminary data from the National Statistical Institute.
The Government Debt of Bulgaria for 2022 is 37 848 million BGN, or 22.9% of GDP.
...Inflation and consumer price indices in March 2023
In March 2023, the monthly inflation rate, measured by the Consumer Price Index (CPI), was 0.5% compared to the previous month, and the annual inflation rate in March 2023 compared to March 2022 was 14.0%.
In March 2023, compared to the previous month, the highest price increase was registered for Miscellaneous goods and services (+2.9%), Restaurants and hotels (+1.2%), Alcoholic beverages and tobacco (+1.1%), Furnishings, household equipment and routine maintenance of the house (+1.0%) and Food and non-alcoholic beverages (+0.9%). The decrease was recorded in the...
Purchasing power parities and GDP per capita - flash estimate
In 2022, Luxembourg and Ireland recorded the highest level of GDP per capita in the EU, at 161% and 134% above the EU average. Bulgaria was the Member State with the lowest GDP per capita, at 41% below the EU average.
...Inflation and consumer price indices in February 2023
In February 2023, the monthly inflation rate, measured by the Consumer Price Index (CPI), was 0.8% compared to the previous month, and the annual inflation rate in February 2023 compared to February 2022 was 16.0%.
In February 2023, compared to the previous month, the highest price increase was registered for Food and non-alcoholic beverages (+2.4%), Communications (+1.9%), Restaurants and hotels (+1.1%), Recreation and culture (1.1%) and Health (+1.0%). The largest decrease was recorded in the prices for Housing, water, electricity, gas and other fuels (-1.2%), C...
Labor productivity, persons employed and hours worked for the Fourth Quarter of 2022
GDP per person employed increased in real terms by 1.7% in the fourth quarter of 2022 compared to the fourth quarter of 2021 according to the preliminary data.
...Gross Domestic Product for the Fourth Quarter of 2022 and 2022 (preliminary data)
In the fourth quarter of 2022, gross domestic product (GDP) grew by 2.3% and gross value added (GVA) by 2.8% compared to the fourth quarter of 2021 (data are preliminary and seasonally adjusted).
The increase in gross value added is determined by the growth in the following economic activities:
Construction - 27.6%, Professional, scientific and technical activities; administrative and support service activities - 5.6%, Mining and quarrying; manufacturing; electricity, gas, steam and air conditioning supply; water supply, waste management and remediation activities - 3.5%...
Labor productivity, persons employed and hours worked for 2022 (preliminary data)
According to the preliminary data, GDP per person employed increased in real terms by 2.1% in 2022 compared to 2021.
...Inflation and consumer price indices in January 2023
According to the preliminary data of the NSI, in January 2023 the monthly inflation rate, measured by the Consumer Price Index (CPI), was 1.1% compared to the previous month, and the annual inflation rate in January 2023 compared to January 2022 was 16.4%.
In January 2023, compared to the previous month, the highest price increase was registered for Transport (+2.3%), Miscellaneous goods and services (+1.7%), Health (+1.5%) and Food and non-alcoholic beverages (+1.5%). The decrease was recorded in the prices for Clothing and footwear (-1.9%) and Recreation and cul...
Gross Domestic Product for the Fourth Quarter of 2022 (Flash Estimates)
According to the seasonally adjusted data, GDP has a growth of 2.1% in the fourth quarter of 2022 compared to the same quarter of the previous year.
...Inflation and consumer price indices in December 2022
In December 2022, the monthly inflation rate, measured by the Consumer Price Index (CPI), was 0.9% compared to the previous month, and the annual inflation rate in December 2022 compared to December 2021 was 16.9%.
In December 2022, compared to the previous month, the highest price increase was registered for Recreation and culture (+8.5%), Health (+2.2%), Miscellaneous goods and services (+1.6%), Restaurants and hotels (+1.4%). The decrease was recorded in the prices for Transport (-2.3%) and Clothing and footwear (-1.2%).
In December 2022, the monthly ...
Consumption per capita in purchasing power standards in 2021
Consumption per capita varied between 65% and 144% of the EU average.
...Inflation and Consumer Price Indices in November 2022
In November 2022, the monthly inflation rate, measured by the Consumer Price Index (CPI), was 0.8% compared to the previous month, and the annual inflation rate in November 2022 compared to November 2021 was 16.6%.
In November 2022, compared to the previous month, the highest price increase was registered for Recreation and culture (+2.9%), Communications (+2.7%), Health (+1.7%), Food and non-alcoholic beverages (+1.7%). The decrease was recorded in the prices for Housing, water, electricity, gas and other fuels (-1.5%) and Transport (-0.5%).
In November...
Labor productivity, persons employed and hours worked for the Third Quarter of 2022
GDP per person employed increased in real terms by 1.7% in the third quarter of 2022 compared to the third quarter of 2021, according to the preliminary data.
...Gross Domestic Product for the Third Quarter of 2022 (preliminary data)
In the third quarter of 2022, gross domestic product (GDP) grew by 3.3% and gross value added (GVA) by 3.1% compared to the third quarter of 2021 (data are preliminary and seasonally adjusted).
The increase in gross value added is determined by the growth in the following economic activities:
Mining and quarrying; manufacturing; electricity, gas, steam and air conditioning supply; water supply, waste management and remediation activities - 17.7% on an annual basis, Professional, scientific and technical activities; administrative and support service activities - 1.4%, Pu...
Inflation and Consumer Price Indices in October 2022
In October 2022, the monthly inflation rate, measured by the Consumer Price Index (CPI), was 0.9% compared to the previous month, and the annual inflation rate in October 2022 compared to October 2021 was 17.6%.
In October 2022, compared to the previous month, the highest price increase was registered for Clothing and footwear (+7.0%), Recreation and culture (+2.7%), Food and non-alcoholic beverages (+2.3%). The decrease was recorded in the prices for Housing, water, electricity, gas and other fuels (-2.1%), Transport (-1.4%) and Communications (-0.1%).
...
Gross Domestic Product for the Third Quarter of 2022 (Flash Estimates)
According to the seasonally adjusted data, GDP has a growth of 3.2% in the third quarter of 2022 compared to the third quarter of the previous year.
...Bulgaria and EU: Deficit and debt of General Government Institutional Sector for 2021
In 2021, the government deficit and debt of the EU decreased in relative terms compared with 2020. In 2021, in the EU, the government deficit to GDP ratio shrank to -4.6% from -6.7% in 2020. In 2021, the government debt to GDP ratio in the EU decreased to 87.9% from 89.8% at the end of 2020.
...Deficit and Debt of General Government Sector in the Republic of Bulgaria in 2021 (final data)
In 2021, the final data from the National Statistical Institute showed that the General Government Institutional Sector reported a deficit of -5 414 million BGN, or 3.9% of GDP.
The Government Debt of Bulgaria for 2021 is 33 268 million BGN, representing 23.9% of GDP.
...Inflation and Consumer Price Indices in September 2022
In September 2022, the monthly inflation rate, measured by the Consumer Price Index (CPI), was 1.2% compared to the previous month, and the annual inflation rate in September 2022 compared to September 2021 was 18.7%.
In September 2022, compared to the previous month, the highest price increase was registered for Education (+5.4%), Housing, water, electricity, gas and other fuels (+4.2%) and Food and non-alcoholic beverages (+2.3%). The decrease was recorded in the prices for Recreation and culture (-4.6%), Transport (-2.9%) and Communications (-1.8%).
I...
Inflation and Consumer Price Indices in August 2022
In August 2022, the monthly inflation rate, measured by the Consumer Price Index (CPI), was 1.2% compared to the previous month, and the annual inflation rate in August 2022 compared to August 2021 was 17.7%.
In August 2022, compared to the previous month, the highest price increase was registered for Housing, water, electricity, gas and other fuels (+5.2%), Miscellaneous goods and services (+2.3%) and Furnishings, household equipment and routine maintenance of the house (+1.8%). The decrease was recorded in the prices for Transport (-3.8%) and Clothing and footwe...
Labor productivity, persons employed and hours worked for the Second Quarter of 2022
GDP per person employed increased in real terms by 2.6% in the second quarter of 2022 compared to the second quarter of 2021, аccording to the preliminary data.
GDP per person employed is 10 946.5 BGN and GDP per hour worked is 27.4 BGN.
Тhe structure of employment by economic sector 2022 shows increase in the relative share of service sector and decrease in agriculture and industrial sectors in the second quarter of 2022 compared with the second quarter of 2021.
...Gross Domestic Product for the Second Quarter of 2022 (preliminary data)
In the second quarter of 2022, gross domestic product (GDP) grew by 4.0% and gross value added (GVA) by 4.5% compared to the second quarter of 2021 (data are preliminary and seasonally adjusted).
The increase in gross value added is determined by the growth in following economic activities:
Mining and quarrying; manufacturing; electricity, gas, steam and air conditioning supply; water supply, waste management and remediation activities - 11.9%, Information and communication - 5.6%, Professional, scientific and technical activities; administrative and support service acti...
Gross Domestic Product for the Second Quarter of 2022 (Flash Estimates)
According to the seasonally adjusted data, GDP has a growth of 4.8% in the second quarter of 2022 compared to the second quarter of the previous year.
...Inflation and Consumer Price Indices in July 2022
In July 2022, the monthly inflation rate, measured by the Consumer Price Index (CPI), was 1.1% compared to the previous month, and the annual inflation rate in July 2022 compared to July 2021 was 17.3%.
In July 2022 compared to June 2022, the highest price increase was registered for Recreation and culture (+7.4%), Housing, water, electricity, gas and other fuels (+5.2%) and Restaurants and hotels (+1.2%). The highest decrease was recorded in the prices for Clothing and footwear (-2.0%), Transport (-1.7%) and Food and non-alcoholic beverages (-0.1%).
In ...
Inflation and Consumer Price Indices in June 2022
The consumer price index in June 2022 compared to May 2022 was 100.9%, i.e. the monthly inflation was 0.9%.
...Consumer price levels in 2021
In 2021, price levels for consumer goods and services differed widely across the EU Member States.
Widest is the gap for ‘Restaurants and hotels’ and ‘Alcohol and tobacco’.
...Actual individual consumption per capita in 2021
Inflation and Consumer Price Indices in May 2022
The consumer price index in May 2022 compared to April 2022 was 101.2%, i.e. the monthly inflation was 1.2%.
...Labor productivity, persons employed and hours worked for the First Quarter of 2022
According to the preliminary data, GDP per person employed increased in real terms by 3.3% in the first quarter of 2022 compared to the same quarter of the previous year.
...Gross Domestic Product for the First Quarter of 2022 (preliminary data)
According to the seasonally adjusted data, GDP increased by 4.0% in the first quarter of 2022 compared with the same quarter of 2021.
...Inflation and Consumer Price Indices in April 2022
The consumer price index in April 2022 compared to March 2022 was 102.5%, i.e. the monthly inflation was 2.5%.
...Gross Domestic Product for the First Quarter of 2022 (Flash Estimates)
According to the seasonally adjusted data, GDP has a growth of 4.5% in the first quarter of 2022 compared to the same quarter of the previous year.
...Bulgaria and EU: Deficit and debt of General Government Institutional Sector for 2021 (preliminary data)
In 2021, the government deficit and debt of the EU decreased in relative terms compared with 2020. In the EU, the government deficit to GDP ratio shrunk from 6.8% in 2020 to 4.7% in 2021. In the EU, the government debt to GDP ratio decreased from 90.0% at the end of 2020 to 88.1% at the end of 2021.
...Deficit and Debt of General Government Sector in the Republic of Bulgaria in 2021 (preliminary data)
According to preliminary data from the National Statistical Institute, the General Government Institutional Sector reported in 2021 a deficit of 5 433 million BGN, or 4.1% of GDP.
The Government Debt of Bulgaria for 2021 is 33 277 million BGN, or 25.1% of GDP.
...Inflation and Consumer Price Indices in March 2022
The consumer price index in March 2022 compared to February 2022 was 102.2%, i.e. the monthly inflation was 2.2%.
...Purchasing power parities and GDP per capita - flash estimate
In 2021, Luxembourg and Ireland recorded the highest level of GDP per capita in the EU, at 177% and 121% above the EU average. Bulgaria was the Member State with the lowest GDP per capita, at 45% below the EU average.
...Inflation and Consumer Price Indices in February 2022
The consumer price index in February 2022 compared to January 2022 was 101.4%, i.e. the monthly inflation was 1.4%.
...Labor productivity, persons employed and hours worked for the Fourth Quarter of 2021
According to the preliminary data, GDP per person employed increased in real terms by 4.3% in the fourth quarter of 2021 compared to the same quarter of the previous year.
...Labor productivity, persons employed and hours worked for 2021 (preliminary data)
According to the preliminary data, GDP per person employed increased in real terms by 4.0% in 2021 compared to the previous year.
...Gross Domestic Product for the Fourth Quarter of 2021 and 2021 (preliminary data)
According to the seasonally adjusted data, GDP increased by 4.7% in the fourth quarter of 2021 compared with the same quarter of 2020.
...Gross Domestic Product for the Fourth Quarter of 2021 (Flash Estimates)
According to the seasonally adjusted flash estimates of GDP has a growth of 4.5% in the fourth quarter of 2021 compared to the same quarter of the previous year.
...Inflation and Consumer Price Indices in January 2022
According to the preliminary data of the NSI, the consumer price index in January 2022 compared to December 2021 was 101.5%, i.e. the monthly inflation was 1.5%.
...Inflation and Consumer Price Indices in December 2021
The consumer price index in December 2021 compared to November 2021 was 100.9%, i.e. the monthly inflation was 0.9%.
...Consumption per capita in purchasing power standards in 2020
Consumption per capita varied between 61% and 145% of the EU average.
...Inflation and Consumer Price Indices in November 2021
The consumer price index in November 2021 compared to October 2021 was 101.4%, i.e. the monthly inflation was 1.4%.
...Gross Domestic Product for the Third Quarter of 2021 (preliminary data)
According to the seasonally adjusted data, GDP increased by 4.6% in the third quarter of 2021 compared with the same quarter of 2020.
...Labor productivity, persons employed and hours worked for the Third Quarter of 2021
According to the preliminary data, GDP per person employed increased in real terms by 1.9% in the third quarter of 2021 compared to the same quarter of the previous year.
...Gross Domestic Product for the Third Quarter of 2021 (Flash Estimates)
According to the seasonally adjusted data GDP has a growth of 0.4% in the third quarter of 2021 compared to the same quarter of the previous year.
...Inflation and Consumer Price Indices in October 2021
The consumer price index in October 2021 compared to September 2021 was 101.8%, i.e. the monthly inflation was 1.8%.
...Bulgaria and EU: Deficit and debt of General Government Institutional Sector for 2020
In 2020, the government deficit and debt of the EU increased in relative terms compared with 2019. In the EU, the government deficit to GDP ratio rose from 0.5% in 2019 to 6.9% in 2020. In the EU, the government debt to GDP ratio increased from 77.2% at the end of 2019 to 90.1% at the end of 2020.
...Deficit and Debt of General Government Sector in the Republic of Bulgaria in 2020 (final data)
According to final data of the National Statistical Institute the General Government Institutional Sector reported in 2020 a deficit of 4 780 million BGN or 4.0% of GDP.
The Government Debt of Bulgaria for 2020 is 29 602 million BGN or 24.7% of GDP.
...Inflation and Consumer Price Indices in September 2021
The consumer price index in September 2021 compared to August 2021 was 100.4%, i.e. the monthly inflation was 0.4%.
...Inflation and Consumer Price Indices in August 2021
The consumer price index in August 2021 compared to July 2021 was 100.8%, i.e. the monthly inflation was 0.8%.
...Gross Domestic Product for the Second Quarter of 2021 (preliminary data)
According to the seasonally adjusted data, GDP increased by 9.9% in the second quarter of 2021 compared with the same quarter of 2020.
...Gross Domestic Product for the Second Quarter of 2021 (Flash Estimates)
According to the seasonally adjusted data GDP has a growth of 9.6% in the second quarter of 2021 compared to the same quarter of the previous year.
...Inflation and Consumer Price Indices in July 2021
The consumer price index in July 2021 compared to June 2021 was 100.8%, i.e. the monthly inflation was 0.8%.
...Inflation and Consumer Price Indices in June 2021
The consumer price index in June 2021 compared to May 2021 was 99.8%, i.e. the monthly inflation was -0.2%.
...Consumer price levels in 2020
In 2020, price levels for consumer goods and services differed widely across the EU Member States.
Widest gap for ‘Restaurants and hotels’ and ‘Alcohol and tobacco’.
...First estimates of purchasing power parities for 2020
Inflation and Consumer Price Indices in May 2021
The consumer price index in May 2021 compared to April 2021 was 100.1%, i.e. the monthly inflation was 0.1%.
...Gross Domestic Product for the First Quarter of 2021 (preliminary data)
According to the seasonally adjusted data, GDP decreased by 1.8% in the first quarter of 2021 compared with the same quarter of 2020.
...Labor productivity, persons employed and hours worked for the First Quarter of 2021
According to the preliminary data, GDP per person employed increased in real terms by 2.0% in the first quarter of 2021 compared to the same quarter of the previous year.
...Gross Domestic Product for the First Quarter of 2021 (Flash Estimates)
According to the seasonally adjusted data, the GDP has a negative growth of 1.8% in the first quarter of 2021 compared to the same quarter of the previous year.
...Inflation and Consumer Price Indices in April 2021
The consumer price index in April 2021 compared to March 2021 was 100.7%, i.e. the monthly inflation was 0.7%.
...Bulgaria and EU: Deficit and debt of General Government Institutional Sector for 2020 (preliminary data)
In 2020, the government deficit and debt of the EU increased in relative terms compared with 2019. In the EU the government deficit to GDP ratio rose from 0.5% in 2019 to 6.9% in 2020. In the EU the government debt to GDP ratio increased from 77.5% at the end of 2019 to 90.7% at the end of 2020.
...Deficit and Debt of General Government Sector in the Republic of Bulgaria in 2020 (preliminary data)
According to preliminary data of the National Statistical Institute the General Government Institutional Sector reported in 2020 a deficit of 4 056 million BGN or 3.4% of GDP.
The Government Debt of Bulgaria for 2020 is 29 703 million BGN or 25.0% of GDP.
...Inflation and Consumer Price Indices in March 2021
The consumer price index in March 2021 compared to February 2021 was 100.1%, i.e. the monthly inflation was 0.1%.
...Inflation and Consumer Price Indices in February 2021
The consumer price index in February 2021 compared to January 2021 was 100.6%, i.e. the monthly inflation was 0.6%.
...Labor productivity, persons employed and hours worked for the Fourth Quarter of 2020
According to the preliminary data, GDP per person employed decreased in real terms by 2.9% in the fourth quarter of 2020 compared to the same quarter of the previous year.
...Gross Domestic Product for the Fourth Quarter of 2020 and 2020 (preliminary data)
According to the seasonally adjusted data, the GDP growth rate in the fourth quarter of 2020 is minus 3.8% compared with the same quarter of 2019.
...Labor productivity, persons employed and hours worked for 2020 (preliminary data)
According to the preliminary data, GDP per person employed decreased in real terms by 1.9% in 2020 compared to the previous year.
...Regional GDP per capita in the EU in 2019
Regional GDP per capita ranged from 32% to 260% of the EU average in 2019.
...Gross Domestic Product for the Fourth Quarter of 2020 (Flash Estimates)
According to the seasonally adjusted data, the GDP has a negative growth of 3.8% in the fourth quarter of 2020 compared to the same quarter of the previous year.
...Inflation and Consumer Price Indices in January 2021
According to the preliminary data of the NSI, the consumer price index in January 2021 compared to December 2020 was 100.2%, i.e. the monthly inflation was 0.2%.
...Inflation and Consumer Price Indices in December 2020
The consumer price index in December 2020 compared to November 2020 was 100.5%, i.e. the monthly inflation was 0.5%.
...Consumption per capita in purchasing power standards in 2019
Consumption per capita varied between 58% and 135% of the EU average.
...Inflation and Consumer Price Indices in November 2020
The consumer price index in November 2020 compared to October 2020 was 100.1%, i.e. the monthly inflation was 0.1%.
...Bulgaria and EU: Gross Domestic Product, third quarter of 2020 (preliminary estimates)
Gross Domestic Product (GDP) in the third quarter of 2020 increased by 11.5% in EU-27 compared to the previous quarter by seasonally adjusted data. For the same period, GDP in Bulgaria increased by 4.3%.
...Labor productivity, persons employed and hours worked for the Third Quarter of 2020
According to the preliminary data, GDP per person employed decreased by 1.6% in the third quarter of 2020 compared to the same quarter of the previous year.
...Gross Domestic Product for the Third Quarter of 2020 (preliminary data)
According to the seasonally adjusted data, GDP decreased by 5.2% in the third quarter of 2020 compared with the same quarter of 2019.
...Inflation and Consumer Price Indices in October 2020
The consumer price index in October 2020 compared to September 2020 was 100.6%, i.e. the monthly inflation was 0.6%.
...Bulgaria and EU: Gross Domestic Product, third quarter of 2020 (Flash Estimates)
Gross Domestic Product (GDP) in the third quarter of 2020 increased by 11.6% in EU-27 compared to the previous quarter by seasonally adjusted data. For the same period, GDP in Bulgaria increased by 4.3%.
...Gross Domestic Product for the Third Quarter of 2020 (Flash Estimates)
According to the seasonally adjusted data, the GDP has a negative growth of 5.2% in the third quarter of 2020 compared to the same quarter of the previous year.
...Bulgaria and EU: Deficit and debt of General Government Institutional Sector for 2019
In 2019, the government deficit of the EU increased in relative terms compared to 2018, while the government debt decreased. In the EU, the government deficit to GDP ratio rose from 0.4% in 2018 to 0.5% in 2019. In the EU the government debt to GDP ratio declined from 79.5% at the end of 2018 to 77.6% at the end of 2019.
...Deficit and Debt of General Government Sector in the Republic of Bulgaria in 2019 (final data)
According to final data of the National Statistical Institute the General Government Institutional Sector reported in 2019 a surplus of 2 304 million BGN or 1.9% of GDP.
The Government Debt of Bulgaria for 2019 is 24 212 million BGN or 20.2% of GDP.
...Inflation and Consumer Price Indices in September 2020
The consumer price index in September 2020 compared to August 2020 was 99.4%, i.e. the monthly inflation was -0.6%.
...Inflation and Consumer Price Indices in August 2020
The consumer price index in August 2020 compared to July 2020 was 100.0%, i.e. the monthly inflation was 0.0%.
...Bulgaria and EU: Gross Domestic Product, second quarter of 2020 (preliminary estimates)
Gross Domestic Product (GDP) in the second quarter of 2020 declined by 11.4% in EU compared to the previous quarter by seasonally adjusted data. For the same period, GDP in Bulgaria decreased by 10.0%.
...Labor productivity, persons employed and hours worked for the Second Quarter of 2020
According to the preliminary data, GDP per person employed decreased by 5.6% in the second quarter of 2020 compared to the same quarter of the previous year.
...Gross Domestic Product for the Second Quarter of 2020 (preliminary data)
According to the seasonally adjusted data, GDP decreased by 8.5% in the second quarter of 2020 compared with the same quarter of 2019.
...Inflation and Consumer Price Indices in July 2020
The consumer price index in July 2020 compared to June 2020 was 100.5%, i.e. the monthly inflation was 0.5%.
...Bulgaria and EU: Gross Domestic Product, second quarter of 2020 (Flash Estimates)
Gross Domestic Product (GDP) in the second quarter of 2020 declined by 11.7% in EU-27 compared to the previous quarter by seasonally adjusted data. For the same period, GDP in Bulgaria decreased by 9.8%.
...Gross Domestic Product for the Second Quarter of 2020 (Flash Estimates)
According to the seasonally adjusted data, the GDP has a negative growth of 8.2% in the second quarter of 2020 compared to the same quarter of the previous year.
...Inflation and Consumer Price Indices in June 2020
The consumer price index in June 2020 compared to May 2020 was 99.6%, i.e. the monthly inflation was -0.4%.
...Consumer price levels in 2019
Price levels varied by almost one to three across the EU Member States.
Widest gap for ‘Restaurants and hotels’ and ‘Alcohol and tobacco’.
Consumption per capita in purchasing power standards, First estimates for 2019
Wide variation of consumption per capita across EU Member States.
GDP per capita ranged from 53% to 261% of EU average.
Inflation and Consumer Price Indices in May 2020
The consumer price index in May 2020 compared to April 2020 was 99.7%, i.e. the monthly inflation was -0.3%.
...Bulgaria and EU: Gross Domestic Product, first quarter of 2020 (preliminary estimates)
Gross Domestic Product (GDP) in the first quarter of 2020 decreased by 3.2% in EU compared to the previous quarter by seasonally adjusted data. For the same period, GDP in Bulgaria increased by 0.3%.
...Labor productivity, persons employed and hours worked for the First Quarter of 2020
According to the preliminary data, GDP per person employed increased by 2.5% in the first quarter of 2020 compared to the same quarter of the previous year.
...Gross Domestic Product for the First Quarter of 2020 (preliminary data)
According to the seasonally adjusted data, the GDP growth rate in the first quarter of 2020 is 2.4% compared with the same quarter of 2019.
...The 2017 results of the International Comparison Program
China, US and EU are the largest economies in the world.
In 2017, the Gross Domestic Product (GDP) of the European Union with 27 Member States (EU) represented 16.0% of world GDP, expressed in Purchasing Power Standards (PPS). China and the United States were the two largest economies, with shares of 16.4% and 16.3% respectively.
...Inflation and Consumer Price Indices in April 2020
The consumer price index in April 2020 compared to March 2020 was 99.4%, i.e. the monthly inflation was -0.6%.
...Bulgaria and EU: Gross Domestic Product, first quarter of 2020 (Flash Estimates)
Gross Domestic Product (GDP) in the first quarter of 2020 decreased by 3.3% in EU-27 compared to the previous quarter by seasonally adjusted data. For the same period, GDP in Bulgaria increased by 0.3%.
...Gross Domestic Product for the First Quarter of 2020 (Flash Estimates)
According to the seasonally adjusted data, the GDP growth rate in the first quarter of 2020 is 2.4% compared to the same quarter of the previous year.
...Bulgaria and EU: Deficit and debt of General Government Institutional Sector for 2019 (preliminary data)
In 2019, the government deficit and debt of the EU-27 increased in relative terms compared with 2018. In the EU-27 the government deficit to GDP ratio rose from 0.4% in 2018 to 0.6% in 2019. In the EU-27 the government debt to GDP ratio declined from 79.6% at the end of 2018 to 77.8% at the end of 2019.
...Deficit and Debt of General Government Sector in the Republic of Bulgaria in 2019 (preliminary data)
According to preliminary data of the National Statistical Institute the General Government Institutional Sector reported in 2019 a surplus of 2 470 million BGN or 2.1% of GDP.
The Government Debt of Bulgaria for 2019 is 24 205 million BGN or 20.4% of GDP.
...Inflation and Consumer Price Indices in March 2020
The consumer price index in March 2020 compared to February 2020 was 99.4%, i.e. the monthly inflation was -0.6%.
...Inflation and Consumer Price Indices in February 2020
The consumer price index in February 2020 compared to January 2020 was 100.1%, i.e. the monthly inflation was 0.1%.
...Bulgaria and EU: Gross Domestic Product, fourth quarter of 2019 (preliminary estimates)
Gross Domestic Product (GDP) in the fourth quarter of 2019 increased by 0.2% in the EU-27 compared to the previous quarter by seasonally adjusted data. For the same period, GDP in Bulgaria increased by 0.8%.
...Regional GDP per capita in the EU in 2018
In 2018, regional GDP per capita, expressed in terms of purchasing power standards (PPS), ranged from 30% of the European Union (EU) average in Mayotte, an overseas region of France, to 263% in Luxembourg.
This information is taken from data released by Eurostat, the statistical office of the European Union.
...Gross Domestic Product for the Fourth Quarter of 2019 and 2019 (preliminary data)
According to the seasonally adjusted data, the GDP growth rate in the fourth quarter of 2019 is 3.1% compared with the same quarter of 2018.
...Labor productivity, persons employed and hours worked for 2019
According to the preliminary data, GDP per person employed increased by 3.0% in 2019 compared to the previous year.
...Labor productivity, persons employed and hours worked for the Fourth Quarter of 2019
According to the preliminary data, GDP per person employed increased by 1.9% in the fourth quarter of 2019 compared to the same quarter of the previous year.
...Bulgaria and EU: Gross Domestic Product, forth quarter of 2019 (Flash Estimates)
Gross Domestic Product (GDP) in the fourth quarter of 2019 increased by 0.1% in the EU-27 compared to the previous quarter by seasonally adjusted data. For the same period, GDP in Bulgaria increased by 0.7%.
...Gross Domestic Product for the Fourth Quarter of 2019 (Flash Estimates)
According to the seasonally adjusted data, the GDP growth rate in the fourth quarter of 2019 is 3.5% compared to the same quarter of the previous year.
...Inflation and Consumer Price Indices in January 2020
According to the preliminary data of the NSI, the consumer price index in January 2020 compared to December 2019 was 100.9%, i.e. the monthly inflation was 0.9%.
...Inflation and Consumer Price Indices in December 2019
The consumer price index in December 2019 compared to November 2019 was 100.7%, i.e. the monthly inflation was 0.7%.
...Inflation and Consumer Price Indices in November 2019
The consumer price index in November 2019 compared to October 2019 was 100.5%, i.e. the monthly inflation was 0.5%.
...Consumption per capita in purchasing power standards in 2018
Consumption per capita varied between 56% and 134% of the EU average.
...Bulgaria and EU: Gross Domestic Product, third quarter of 2019 (preliminary estimates)
Gross Domestic Product (GDP) in the third quarter of 2019 increased by 0.3% in the EU-28 compared to the previous quarter by seasonally adjusted data. For the same period, GDP in Bulgaria increased by 0.8%.
...Labor productivity, persons employed and hours worked for the Third Quarter of 2019
According to the preliminary data, GDP per person employed increased by 3.0% in the third quarter of 2019 compared to the same quarter of the previous year.
...Gross Domestic Product for the Third Quarter of 2019 (preliminary data)
According to the seasonally adjusted data, the GDP growth rate in the third quarter of 2019 is 3.7% compared with the same quarter of 2018 according to the preliminary estimates.
...Bulgaria and EU: Gross Domestic Product, third quarter of 2019 (Flash Estimates)
Gross Domestic Product (GDP) in the third quarter of 2019 increased by 0.3% in the EU-28 compared to the previous quarter by seasonally adjusted data. For the same period, GDP in Bulgaria increased by 0.7%.
...Gross Domestic Product for the Third Quarter of 2019 (Flash Estimates)
According to the seasonally adjusted data, the GDP growth rate in the third quarter of 2019 is 3.7% compared to the same quarter of the previous year.
...Inflation and Consumer Price Indices in October 2019
The consumer price index in October 2019 compared to September 2019 was 100.8%, i.e. the monthly inflation was 0.8%.
...Bulgaria and EU: Deficit and debt of General Government Institutional Sector for 2018
In 2018, the government deficit and debt of the EU-28 decreased compared to 2017. In the EU-28 the government deficit to GDP ratio fell from 1.0% in 2017 to 0.7% in 2018. In the EU-28 the government debt to GDP ratio declined from 82.1% at the end of 2017 to 80.4% at the end of 2018.
...Deficit and Debt of General Government Sector in the Republic of Bulgaria in 2018 (final data)
According to final data of the National Statistical Institute the General Government Institutional Sector reported in 2018 a surplus of 1 921 million BGN or 1.8% of GDP.
The Government Debt of Bulgaria for 2018 is 24 431 million BGN or 22.3% of GDP.
...Inflation and Consumer Price Indices in September 2019
The consumer price index in September 2019 compared to August 2019 was 99.7%, i.e. the monthly inflation was -0.3%.
...Inflation and Consumer Price Indices in August 2019
The consumer price index in August 2019 compared to July 2019 was 100.1%, i.e. the monthly inflation was 0.1%.
...Gross Domestic Product for the Second Quarter of 2019 (preliminary data)
According to the seasonally adjusted data, the GDP growth rate in the second quarter of 2019 is 3.5% compared with the same quarter of 2018 according to the preliminary estimates.
...Labor productivity, persons employed and hours worked for the Second Quarter of 2019
According to the preliminary data, GDP per person employed increased by 3.5% in the second quarter of 2019 compared to the same quarter of the previous year.
...Bulgaria and EU: Gross Domestic Product, second quarter of 2019 (Flash Estimates)
Gross Domestic Product (GDP) in the second quarter of 2019 increased by 0.2% in the EU-28 compared to the previous quarter by seasonally adjusted data. For the same period, GDP in Bulgaria increased by 0.6%.
...Inflation and Consumer Price Indices in July 2019
The consumer price index in July 2019 compared to June 2019 was 100.8%, i.e. the monthly inflation was 0.8%.
...Gross Domestic Product for the Second Quarter of 2019 (Flash Estimates)
According to the seasonally adjusted data, the GDP growth rate in the second quarter of 2019 is 3.3% compared to the same quarter of the previous year.
...Inflation and Consumer Price Indices in June 2019
The consumer price index in June 2019 compared to May 2019 was 99.4%, i.e. the monthly inflation was -0.6%.
...Consumer price levels in 2018
Price levels of food and non-alcoholic beverages ranged from 66% of the EU average in Romania to 130% in Denmark in 2018.
...Consumption per capita in purchasing power standards, First estimates for 2018
Wide variation of consumption per capita across EU Member States.
GDP per capita ranged from 50% to 254% of EU average.
Inflation and Consumer Price Indices in May 2019
The consumer price index in May 2019 compared to April 2019 was 100.1%, i.e. the monthly inflation was 0.1%.
...Bulgaria and EU: Gross Domestic Product, first quarter of 2019 (preliminary estimates)
Gross Domestic Product (GDP) in the first quarter of 2019 increased by 0.5% in the EU-28 compared to the previous quarter by seasonally adjusted data. For the same period, GDP in Bulgaria increased by 1.2%.
...Labor productivity, persons employed and hours worked for the First Quarter of 2019
According to the preliminary data, GDP per person employed increased by 4.6% in the first quarter of 2019 compared to the same quarter of the previous year.
...Gross Domestic Product for the First Quarter of 2019 (preliminary data)
According to the seasonally adjusted data, the GDP growth rate in the first quarter of 2019 is 3.5% compared with the same quarter of 2018 according to the preliminary estimates.
...Bulgaria and EU: Gross Domestic Product, first quarter of 2019 (Flash Estimates)
Gross Domestic Product (GDP) in the first quarter of 2019 increased by 0.5% in the EU-28 compared to the previous quarter by seasonally adjusted data. For the same period, GDP in Bulgaria increased by 1.1%.
...Gross Domestic Product for the First Quarter of 2019 (Flash Estimates)
According to the seasonally adjusted data, the GDP growth rate in the first quarter of 2019 is 3.4% compared to the same quarter of the previous year.
...Inflation and Consumer Price Indices in April 2019
The consumer price index in April 2019 compared to March 2019 was 100.5%, i.e. the monthly inflation was 0.5%.
...Bulgaria and EU: Deficit and debt of General Government Institutional Sector for 2018 (preliminary data)
In 2018, the government deficit and debt of the EU-28 decreased in relative terms compared with 2017. In the EU-28 the government deficit to GDP ratio fell from 1.0% in 2017 to 0.6% in 2018. In the EU-28 the government debt to GDP ratio declined from 81.7% at the end of 2017 to 80.0% at the end of 2018.
...Deficit and Debt of General Government Institutional Sector in the Republic of Bulgaria in 2018 (preliminary data)
According to preliminary data of the National Statistical Institute the General Government Institutional Sector reported in 2018 a surplus of 2 149 million BGN or 2.0% of GDP.
The Government Debt of Bulgaria for 2018 is 24 430 million BGN or 22.6% of GDP.
...Inflation and Consumer Price Indices in March 2019
The consumer price index in March 2019 compared to February 2019 was 100.1%, i.e. the monthly inflation was 0.1%.
...Inflation and Consumer Price Indices in February 2019
The consumer price index in February 2019 compared to January 2019 was 100.5%, i.e. the monthly inflation was 0.5%.
...Bulgaria and EU: Gross Domestic Product, fourth quarter of 2018 (preliminary estimates)
Gross Domestic Product (GDP) in the fourth quarter of 2018 increased by 0.3% in the EU-28 compared to the previous quarter by seasonally adjusted data. For the same period, GDP in Bulgaria increased by 0.8%.
...Gross Domestic Product for the Fourth Quarter of 2018 and 2018 (preliminary data)
According to the seasonally adjusted data, the GDP growth rate in the fourth quarter of 2018 is 3.2% compared with the same quarter of 2017.
...Labor productivity, persons employed and hours worked for the Fourth Quarter of 2018
According to the preliminary data, GDP per person employed increased by 3.8% in the fourth quarter of 2018 compared to the same quarter of the previous year.
...Labor productivity, persons employed and hours worked for 2018
According to the preliminary data, GDP per person employed increased by 3.2% in 2018 compared to the previous year.
...Regional GDP per capita in the EU in 2017
In 2017, regional GDP per capita, expressed in terms of purchasing power standards, ranged from 31% of the European Union (EU) average in the Bulgarian region of North-West, to 626% of the average in Inner London - West in the United Kingdom.
This information is taken from data released by Eurostat, the statistical office of the European Union.
...Inflation and Consumer Price Indices in January 2019
According to the preliminary data of the NSI, the consumer price index in January 2019 compared to December 2018 was 100.5%, i.e. the monthly inflation was 0.5%.
...Bulgaria and EU: Gross Domestic Product, fourth quarter of 2018 (Flash Estimates)
Gross Domestic Product (GDP) in the fourth quarter of 2018 increased by 0.2% in the EU-28 compared to the previous quarter by seasonally adjusted data. For the same period, GDP in Bulgaria increased by 0.7%.
...Gross Domestic Product for the Fourth Quarter of 2018 (Flash Estimates)
According to the seasonally adjusted data, the GDP growth rate in the fourth quarter of 2018 is 3.1% compared to the same quarter of the previous year.
...Inflation and Consumer Price Indices in December 2018
The consumer price index in December 2018 compared to November 2018 was 100.0%, i.e. the monthly inflation was 0.0%.
...Consumption per capita in purchasing power standards in 2017
Consumption per capita varied between 54 and 132% of the EU average.
...Inflation and Consumer Price Indices in November 2018
The consumer price index in November 2018 compared to October 2018 was 99.9%, i.e. the monthly inflation was -0.1%.
...Bulgaria and EU: Gross Domestic Product, third quarter of 2018 (preliminary estimates)
Gross Domestic Product (GDP) in the third quarter of 2018 increased by 0.3% in the EU-28 compared to the previous quarter by seasonally adjusted data. For the same period, GDP in Bulgaria increased by 0.7%.
...Labor productivity, persons employed and hours worked for the Third Quarter of 2018
According to the preliminary data, GDP per person employed increased by 3.7% in the third quarter of 2018 compared to the same quarter of the previous year.
...Gross Domestic Product for the Third Quarter of 2018 (preliminary data)
According to the seasonally adjusted data, the GDP growth rate in the third quarter of 2018 is 3.1% compared with the same quarter of 2017 according to the preliminary estimates.
...Bulgaria and EU: Gross Domestic Product, third quarter of 2018 (Flash Estimates)
Gross Domestic Product (GDP) in the third quarter of 2018 increased by 0.3% in the EU-28 compared to the previous quarter by seasonally adjusted data. For the same period, GDP in Bulgaria increased by 0.5%.
...Inflation and Consumer Price Indices in October 2018
The consumer price index in October 2018 compared to September 2018 was 100.7%, i.e. the monthly inflation was 0.7%.
...Gross Domestic Product for the Third Quarter of 2018 (Flash Estimates)
According to the seasonally adjusted data, the GDP growth rate in the third quarter of 2018 is 3.0% compared to the same quarter of the previous year.
...Bulgaria and EU: Deficit and debt of General Government Institutional Sector for 2017
In 2017, the government deficit and debt of the EU-28 decreased in relative terms compared with 2016. In the EU-28 the government deficit to GDP ratio fell from 1.7% in 2016 to 1.0% in 2017. In the EU-28 the government debt to GDP ratio declined from 83.3% at the end of 2016 to 81.6% at the end of 2017.
...Deficit and Debt of General Government Sector in the Republic of Bulgaria in 2017 (final data)
According to final data of the National Statistical Institute the General Government Institutional Sector reported in 2017 a surplus of 1 145 million BGN or 1.1% of GDP.
The Government Debt of Bulgaria for 2017 is 25 908 million BGN or 25.6% of GDP.
...Inflation and Consumer Price Indices in September 2018
The consumer price index in September 2018 compared to August 2018 was 100.3%, i.e. the monthly inflation was 0.3%.
...Inflation and Consumer Price Indices in August 2018
The consumer price index in August 2018 compared to July 2018 was 100.1%, i.e. the monthly inflation was 0.1%.
...Bulgaria and EU: Gross Domestic Product, second quarter of 2018 (preliminary estimates)
Gross Domestic Product (GDP) in the second quarter of 2018 increased by 0.4% in the EU-28 compared to the previous quarter by seasonally adjusted data. For the same period, GDP in Bulgaria increased by 0.8%.
...Labor productivity, persons employed and hours worked for the Second Quarter of 2018
According to the preliminary data, GDP per person employed increased by 3.0% in the second quarter of 2018 compared to the same quarter of the previous year.
...Gross Domestic Product for the Second Quarter of 2018 (preliminary data)
According to the seasonally adjusted data, the GDP growth rate in the second quarter of 2018 is 3.4% compared with the same quarter of 2017 according to the preliminary estimates.
...Bulgaria and EU: Gross Domestic Product, second quarter of 2018 (Flash Estimates)
Gross Domestic Product (GDP) in the second quarter of 2018 increased by 0.4% in the EU-28 compared to the previous quarter by seasonally adjusted data. For the same period, GDP in Bulgaria increased by 0.8%.
...Gross Domestic Product for the Second Quarter of 2018 (Flash Estimates)
According to the seasonally adjusted data, the GDP growth rate in the second quarter of 2018 is 3.4% compared to the same quarter of the previous year.
...Inflation and Consumer Price Indices in July 2018
The consumer price index in July 2018 compared to June 2018 was 100.7%, i.e. the monthly inflation was 0.7%.
...Inflation and Consumer Price Indices in June 2018
The consumer price index in June 2018 compared to May 2018 was 100.1%, i.e. the monthly inflation was 0.1%.
...Consumer price levels in 2017
Price levels varied by almost one to three across the EU Member States.
Widest gap for ‘Restaurants and hotels’ and ‘Alcohol and tobacco’.
Consumption per capita in purchasing power standards, First estimates for 2017
Wide variation of consumption per capita across EU Member States. GDP per capita ranged from 49% to 253% of EU average.
...Inflation and Consumer Price Indices in May 2018
The consumer price index in May 2018 compared to April 2018 was 100.3%, i.e. the monthly inflation was 0.3%.
...Bulgaria and EU: Gross Domestic Product, first quarter of 2018 (preliminary estimates)
Gross Domestic Product (GDP) in the first quarter of 2018 increased by 0.4% in the EU-28 compared to the previous quarter by seasonally adjusted data. For the same period, GDP in Bulgaria increased by 0.9%.
...Gross Domestic Product for the First Quarter of 2018 (preliminary data)
According to the seasonally adjusted data, the GDP growth rate in the first quarter of 2018 is 3.6% compared with the same quarter of 2017 according to the preliminary estimates.
...Labor productivity, persons employed and hours worked for the First Quarter of 2018
According to the preliminary data, GDP per person employed increased by 2.3% in the first quarter of 2018 compared to the same quarter of the previous year.
...Bulgaria and EU: Gross Domestic Product, first quarter of 2018 (Flash Estimates)
Gross Domestic Product (GDP) in the first quarter of 2018 increased by 0.4% in the EU-28 compared to the previous quarter by seasonally adjusted data. For the same period GDP in Bulgaria increased by 0.8%.
...Inflation and Consumer Price Indices in April 2018
The consumer price index in April 2018 compared to March 2018 was 100.4%, i.e. the monthly inflation was 0.4%.
...Gross Domestic Product for the First Quarter of 2018 (Flash Estimates)
According to the seasonally adjusted data, the GDP growth rate in the first quarter of 2018 is 3.5% compared to the same quarter of the previous year.
...Bulgaria and EU: Deficit and debt of General Government Institutional Sector for 2017 (preliminary data)
In 2017, the government deficit and debt of the EU-28 decreased in relative terms compared with 2016. In the EU-28 the government deficit to GDP ratio fell from 1.6% in 2016 to 1.0% in 2017. In the EU-28 the government debt to GDP ratio declined from 83.3% at the end of 2016 to 81.6% at the end of 2017.
...Deficit and Debt of General Government Institutional Sector in the Republic of Bulgaria in 2017 (preliminary data)
According to the preliminary data of the National Statistical Institute the General Government Institutional Sector reported in 2017 a surplus of 920 million BGN or 0.9% of GDP.
The Government Debt of Bulgaria for 2017 is 25 064 million BGN or 25.4% of GDP.
...Inflation and Consumer Price Indices in March 2018
The consumer price index in March 2018 compared to February 2018 was 99.7%, i.e. the monthly inflation was -0.3%.
...Pension entitlements in Bulgarian social insurance for 2015
In 2018 Bulgaria publishes for the first time data on pension entitlements in social insurance for 2015. The accrued-to-date liabilities at the beginning of 2015 (closing balance of 2014) are 144 145 mln. BGN and the accrued-to-date liabilities at the end of 2015 are 149 879 mln. BGN or 169% of GDP.
...Inflation and Consumer Price Indices in February 2018
The consumer price index in February 2018 compared to January 2018 was 100.3%, i.e. the monthly inflation was 0.3%.
...Bulgaria and EU: Gross Domestic Product, fourth quarter of 2017 (preliminary estimates)
Gross Domestic Product (GDP) in the fourth quarter of 2017 increased by 0.6% in the EU-28 compared to the previous quarter by seasonally adjusted data. For the same period GDP in Bulgaria increased by 0.7%.
...Gross Domestic Product for the Fourth Quarter of 2017 and 2017 (preliminary data)
According to the seasonally adjusted data, the GDP growth rate in the fourth quarter of 2017 is 3.5% compared with the same quarter of 2016.
...Labor productivity, persons employed and hours worked for the Fourth Quarter of 2017
According to the preliminary data, GDP per person employed increased by 0.7% in the fourth quarter of 2017 compared to the same quarter of the previous year.
...Regional GDP per capita in the EU in 2016
In 2016, regional GDP per capita, expressed in terms of purchasing power standards, ranged from 29% of the European Union (EU) average in the Bulgarian region of Severozapaden, to 611% of the average in Inner London - West in the United Kingdom.
This information is taken from data released by Eurostat, the statistical office of the European Union.
...Inflation and Consumer Price Indices in January 2018
According to the preliminary data of the NSI, the consumer price index in January 2018 compared to December 2017 was 100.3%, i.e. the monthly inflation was 0.3%.
...Bulgaria and EU: Gross Domestic Product, fourth quarter of 2017 (Flash Estimates)
Gross Domestic Product (GDP) in the fourth quarter of 2017 increased by 0.6% in the EU-28 compared to the previous quarter by seasonally adjusted data. For the same period GDP in Bulgaria increased by 0.8%.
...Gross Domestic Product for the Fourth Quarter of 2017 (Flash Estimates)
According to the seasonally adjusted data, the GDP growth rate in the fourth quarter of 2017 is 3.6% compared to the same quarter of the previous year.
...Inflation and Consumer Price Indices in December 2017
The consumer price index in December 2017 compared to November 2017 was 100.4%, i.e. the monthly inflation was 0.4%.
...Consumption per capita in purchasing power standards in 2016
Consumption per capita varied between 53% and 132% of the EU average.
...Inflation and Consumer Price Indices in November 2017
The consumer price index in November 2017 compared to October 2017 was 100.4%, i.e. the monthly inflation was 0.4%.
...Bulgaria and EU: Gross Domestic Product, third quarter of 2017 (preliminary estimates)
Gross Domestic Product (GDP) in the third quarter of 2017 increased by 0.6% in the EU-28 compared to the previous quarter by seasonally adjusted data. For the same period GDP in Bulgaria increased by 0.9%.
...Gross Domestic Product for the Third Quarter of 2017 (preliminary data)
According to the seasonally adjusted data, the GDP growth rate in the third quarter of 2017 is 3.9% compared with the same quarter of 2016 according to the preliminary estimates.
...Bulgaria and EU: Gross Domestic Product, third quarter of 2017 (Flash Estimates)
Gross Domestic Product (GDP) in the third quarter of 2017 increased by 0.6% in the EU-28 compared to the previous quarter by seasonally adjusted data. For the same period GDP in Bulgaria increased by 0.9%.
...Gross Domestic Product for the Third Quarter of 2017 (Flash Estimates)
According to the seasonally adjusted data, the GDP growth rate in the third quarter of 2017 is 3.9% compared to the same quarter of the previous year.
...Inflation and Consumer Price Indices in October 2017
The consumer price index in October 2017 compared to September 2017 was 100.6%, i.e. the monthly inflation was 0.6%.
...Bulgaria and EU: Deficit and debt of General Government Institutional Sector for 2016
In 2016, the government deficit and debt of the EU-28 decreased in relative terms compared with 2015. In the EU-28 the government deficit to GDP ratio fell from 2.4% in 2015 to 1.7% in 2016. In the EU-28 the government debt to GDP ratio declined from 84.5% at the end of 2015 to 83.2% at the end of 2016.
...Deficit and Debt of General Government Sector in the Republic of Bulgaria in 2016 (final data)
According to the final data of the National Statistical Institute the General Government Institutional Sector reported in 2016 a deficit of 36 million BGN or 0.04% of GDP.
The Government Debt of Bulgaria for 2016 is 27 322 million BGN or 29.03% of GDP.
...Inflation and Consumer Price Indices in September 2017
The consumer price index in September 2017 compared to August 2017 was 100.2%, i.e. the monthly inflation was 0.2%.
...Inflation and Consumer Price Indices in August 2017
The consumer price index in August 2017 compared to July 2017 was 100.1%, i.e. the monthly inflation was 0.1%.
...Bulgaria and EU: Gross Domestic Product, second quarter of 2017 (preliminary data)
Gross Domestic Product (GDP) in the second quarter of 2017 increased by 0.7% in the EU-28 compared to the previous quarter by seasonally adjusted data. For the same period GDP in Bulgaria increased by 1.0%.
...Gross Domestic Product for the Second Quarter of 2017 (preliminary data)
According to the seasonally adjusted data, the GDP growth rate in the second quarter of 2017 is 3.6% compared with the same quarter of 2016 according to the preliminary estimates.
...Gross Domestic Product for the Second Quarter of 2017 (Flash Estimates)
According to the seasonally adjusted data, the GDP growth rate in the second quarter of 2017 is 3.6% compared to the same quarter of the previous year.
...Inflation and Consumer Price Indices in July 2017
The consumer price index in July 2017 compared to June 2017 was 100.3%, i.e. the monthly inflation was 0.3%.
...Inflation and Consumer Price Indices in June 2017
The consumer price index in June 2017 compared to May 2017 was 99.5%, i.e. the monthly inflation was -0.5%.
...Consumer price levels in 2016
Price levels varied by almost one to three across the EU Member States.
Widest gap for "Restaurants & hotels" and "Alcohol & tobacco".
Inflation and Consumer Price Indices in May 2017
The consumer price index in May 2017 compared to April 2017 was 99.7%, i.e. the monthly inflation was -0.3%.
Consumption per capita in purchasing power standards, First estimates for 2016
Consumption per capita varied by more than one to two across EU Member States. GDP per capita by almost one to six.
...Gross Domestic Product for the First Quarter of 2017 (preliminary data)
According to the seasonally adjusted data, the GDP growth rate in the first quarter of 2017 is 3.5% compared with the same quarter of 2016.
...Gross Domestic Product for the First Quarter of 2017 (Flash Estimates)
According to the seasonally adjusted data, the GDP growth rate in the first quarter of 2017 is 3.4% compared to the same quarter of the previous year.
...Inflation and Consumer Price Indices in April 2017
The consumer price index in April 2017 compared to March 2017 was 100.7%, i.e. the monthly inflation was 0.7%.
...Deficit and Debt of General Government Institutional Sector in the Republic of Bulgaria in 2016 (preliminary data)
According to the preliminary data of the National Statistical Institute the General Government Institutional Sector reported in 2016 a surplus of 30 million BGN or 0.03% of GDP.
The Government Debt of Bulgaria for 2016 is 27 321 million BGN or 29.5% of GDP.
...Inflation and Consumer Price Indices in March 2017
The consumer price index in March 2017 compared to February 2017 was 99.5%, i.e. the monthly inflation was -0.5%.
...Regional GDP per capita in the EU in 2015
In 2015, regional GDP per capita, expressed in terms of purchasing power standards, ranged from slightly less than 30% of the European Union (EU) average in the Bulgarian region of Severozapaden, to 580% of the average in Inner London - West in the United Kingdom.
This information is taken from data released by Eurostat, the statistical office of the European Union.
...Inflation and Consumer Price Indices in February 2017
The consumer price index in February 2017 compared to January 2017 was 100.0%, i.e. the monthly inflation was 0.0%.
...Gross Domestic Product for the Fourth Quarter of 2016 and 2016 (preliminary data)
According to the seasonally adjusted data, the GDP growth rate in the fourth quarter of 2016 is 3.4% compared with the same quarter of 2015.
...Inflation and Consumer Price Indices in January 2017
According to the preliminary data of the NSI, the consumer price index in January 2017 compared to December 2016 was 101.3%, i.e. the monthly inflation was 1.3%.
...Gross Domestic Product for the Fourth Quarter of 2016 (Flash Estimates)
According to the seasonally adjusted data, the GDP growth rate in the fourth quarter of 2016 is 3.4% compared to the same quarter of the previous year.
...Inflation and Consumer Price Indices in December 2016
The consumer price index in December 2016 compared to November 2016 was 100.6%, i.e. the monthly inflation was 0.6%.
...Consumption per capita in purchasing power standards in 2015
Consumption per capita varied between 53% and 137% of the EU average.
...Inflation and Consumer Price Indices in November 2016
The consumer price index in November 2016 compared to October 2016 was 100.0%, i.e. the monthly inflation was 0.0%.
...Gross Domestic Product for the Third Quarter of 2016 (preliminary data)
According to the seasonally adjusted data, the GDP growth rate in the third quarter of 2016 is 3.4% compared with the same quarter of 2015.
...Gross Domestic Product for the Third Quarter of 2016 (Flash Estimates)
According to the seasonally adjusted data, the GDP growth rate in the third quarter of 2016 is 3.5% compared to the same quarter of the previous year.
...Inflation and Consumer Price Indices in October 2016
The consumer price index in October 2016 compared to September 2016 was 100.2%, i.e. the monthly inflation was 0.2%.
...Deficit and Debt of General Government Institutional Sector in the Republic of Bulgaria in 2015
According to the final data of the National Statistical Institute the General Government Institutional Sector reported in 2015 a deficit of 1 490 million BGN or 1.7% of GDP.
The Government Debt of Bulgaria for 2015 is 23 049 million BGN or 26.0% of GDP.
...Inflation and Consumer Price Indices in September 2016
The consumer price index in September 2016 compared to August 2016 was 99.5%, i.e. the monthly inflation was -0.5%.
...Inflation and Consumer Price Indices in August 2016
The consumer price index in August 2016 compared to July 2016 was 100.0%, i.e. the monthly inflation was 0.0%.
...Gross Domestic Product for the Second Quarter of 2016 (preliminary data)
According to the seasonally adjusted data, the GDP growth rate in the second quarter of 2016 is 3.0% compared with the same quarter of 2015.
...Gross Domestic Product for the Second Quarter of 2016 (Flash Estimates)
According to the seasonally adjusted data, the GDP growth rate in the second quarter of 2016 is 3.0% compared to the same quarter of the previous year.
...Inflation and Consumer Price Indices in July 2016
The consumer price index in July 2016 compared to June 2016 was 101.0%, i.e. the monthly inflation was 1.0%.
...Inflation and Consumer Price Indices in June 2016
The consumer price index in June 2016 compared to May 2016 was 99.9%, i.e. the monthly inflation was -0.1%.
...Consumption per capita in purchasing power standards, First estimates for 2015
Consumption per capita varied by almost one to three across EU Member States. GDP per capita by nearly one to six.
...Inflation and Consumer Price Indices in May 2016
The consumer price index in May 2016 compared to April 2016 was 100.0%, i.e. the monthly inflation was 0.0%.
...Gross Domestic Product for the First Quarter of 2016 (preliminary data)
According to the seasonally adjusted data, the GDP growth rate in the first quarter of 2016 is 2.9% compared to the same quarter of the previous year.
...Inflation and Consumer Price Indices in April 2016
The consumer price index in April 2016 compared to March 2016 was 100.0%, i.e. the monthly inflation was 0.0%.
...Gross Domestic Product for the First Quarter of 2016 (Flash Estimates)
According to the seasonally adjusted data, the GDP growth rate in the first quarter of 2016 is 2.9% compared to the same quarter of the previous year.
...Deficit and Debt of General Government Institutional Sector in the Republic of Bulgaria in 2015 (preliminary data)
According to the preliminary data of the National Statistical Institute the General Government Institutional Sector reported in 2015 a deficit of 1 774 million BGN or 2.1% of GDP.
The Government Debt of Bulgaria for 2015 is 23 027 million BGN or 26.7% of GDP.
Inflation and Consumer Price Indices in March 2016
The consumer price index in March 2016 compared to February 2016 was 99.3%, i.e. the monthly inflation was -0.7%.
...Inflation and Consumer Price Indices in February 2016
The consumer price index in February 2016 compared to January 2016 was 99.7%, i.e. the monthly inflation was -0.3%.
Gross Domestic Product for the Fourth Quarter of 2015 and Preliminary Data for 2015
According to the seasonally adjusted data, the GDP growth rate in the fourth quarter of 2015 is 3.0% compared to the same quarter of the previous year.
...Regional GDP per capita in the EU in 2014
In 2014, regional GDP per capita, expressed in terms of purchasing power standards, ranged from 30% of the European Union (EU) average in the Bulgarian region of Severozapaden, to 539% of the average in Inner London-West in the United Kingdom.
This information is taken from data released by Eurostat, the statistical office of the European Union.
...Inflation and Consumer Price Indices in January 2016
According to the preliminary data of the NSI, the consumer price index in January 2016 compared to December 2015 was 100.0%, i.e. the monthly inflation was 0.0%.
...Gross Domestic Product for the Fourth Quarter of 2015 (Flash Estimates)
According to the seasonally adjusted data, the GDP growth rate in the fourth quarter of 2015 is 3.1% compared to the same quarter of the previous year.
...Inflation and Consumer Price Indices in December 2015
The consumer price index in December 2015 compared to November 2015 was 100.0%, i.e. the monthly inflation was 0.0%.
...Inflation and Consumer Price Indices in November 2015
The consumer price index in November 2015 compared to October 2015 was 99.9%, i.e. the monthly inflation was -0.1%.
...Consumption per capita in purchasing power standards in 2014
Consumption per capita varied between 51% and 141% of the EU average.
...Gross Domestic Product, Third Quarter of 2015 (preliminary data)
According to the seasonally adjusted data, the GDP growth rate in the third quarter of 2015 is 2.9% compared with the same quarter of 2014.
Gross Domestic Product for the Third Quarter of 2015 (Flash Estimates)
According to the seasonally adjusted data, the GDP growth rate in the third quarter of 2015 is 2.9% compared to the same quarter of the previous year.
Inflation and Consumer Price Indices in October 2015
The consumer price index in October 2015 compared to September 2015 was 100.2%, i.e. the monthly inflation was 0.2%.
Deficit and Debt of General Government Sector in 2014
On the basis of final data of the National Statistical Institute in 2014 the deficit of General Government Sector amounted to 4 826 million BGN or 5.8% of GDP.
Inflation and Consumer Price Indices in September 2015
The consumer price index in September 2015 compared to August 2015 was 99.9%, i.e. the monthly inflation was -0.1%.
...Inflation and Consumer Price Indices in August 2015
The consumer price index in August 2015 compared to July 2015 was 100.0%, i.e. the monthly inflation was 0.0%.
...Gross Domestic Product, Second Quarter of 2015 (preliminary data)
According to the seasonally adjusted data, the GDP growth rate in the second quarter of 2015 is 2.2% compared with the same quarter of 2014.
...Gross Domestic Product for the Second Quarter of 2015 (Flash Estimates)
According to the seasonally adjusted data, the GDP growth rate in the second quarter of 2015 is 2.2% compared to the same quarter of the previous year.
...Inflation and Consumer Price Indices in July 2015
The consumer price index in July 2015 compared to June 2015 was 99.8%, i.e. the monthly inflation was -0.2%.
...Inflation and Consumer Price Indices in June 2015
The consumer price index in June 2015 compared to May 2015 was 99.1%, i.e. the monthly inflation was -0.9%.
...Gross Domestic Product, First Quarter of 2015 (preliminary data)
According to the seasonally adjusted data, the GDP growth rate in the first quarter of 2015 is 2.0% compared with the same quarter of 2014.
...Regional GDP per capita in the EU in 2013
This News Release is the first on regional GDP based on the ESA 2010 methodology and data transmission programme. All the methodological changes that were implemented at national level as of September 2014 are applied at the regional level as well. The regional GDP release will be accelerated from now on by one year.
In 2013, regional GDP per capita, expressed in terms of purchasing power standards, ranged from 27% of the EU28 average in the French overseas department of Mayotte, to 325% of the average in Inner London in the United Kingdom.
...Deficit and Debt of General Government Sector in the Republic of Bulgaria in 2014 (preliminary data)
On the basis of preliminary data of the National Statistical Institute the General Government Sector reported in 2014 government deficit of 2 337 million BGN or 2.8% of GDP. The Government Debt of Bulgaria for 2014 is 22 694 million BGN or 27.6% of GDP.
...Consumption per capita in purchasing power standards in 2013
Consumption per capita varied between 49% and 136% of the EU28 average.
...Deficit and Debt of General Government Sector for the period 2010 - 2013 according to ESA 2010
According to the updated European System of National and Regional Accounts (ESA 2010) the National Statistical Institute reported on the basis of final data for General Government sector in 2013 deficit of 989 million BGN or 1.2% of GDP. The Government debt of Bulgaria for 2013 is 14 731 million BGN or 18.3% of GDP.
...The 2011 results of the International Comparison Program
Deficit and Debt of General Government Sector in 2013 (preliminary data)
On the basis of preliminary data of the National Statistical Institute the General Government Sector reported in 2013 government deficit of 1 178 million BGN or 1.5% of GDP.
The Government Debt of Bulgaria for 2013 is 14 733 million BGN or 18.9% of GDP.
...Deficit and Debt of General Government Sector in 2012
On the basis of final data of the National Statistical Institute in 2012 the General Government Sector has reported a deficit of 592 million BGN or 0.8% of GDP.
The Government Debt of Bulgaria for 2012 is 14 388 million BGN or 18.5% of GDP.
Deficit and Debt of General Government Sector in 2012 (preliminary data)
GDP per capita in purchasing power standards, 2011
Deficit and Debt of General Government Sector in 2011
Deficit and Debt of General Government Sector in 2011 (preliminary data)
Deficit and Debt of General Government Sector in 2010
Deficit and Debt of General Government Sector in 2010 (preliminary data)
Deficit and Debt of General Government Sector in 2009
Key Indicators for Bulgaria (as of 03.04.2024)

Key Indicators for Bulgaria (as of 29.12.2023)

Key Indicators for Bulgaria (as of 02.10.2023)

Statistical Reference Book 2023 (Bulgarian version)
The National Statistical Institute presents to users of statistical information the annual publication - Statistical Reference Book 2023 in Bulgarian.
The Statistical Reference Book presents topical information on the demographic processes as well as the economic, social and cultural development of the Republic of Bulgaria for the 2018 - 2022 period.
The publication presents data on main macroeconomic indicators of the national economy - gross domestic product, investments and finance; and economic activity groupings ...
Statistical Reference Book 2023
The National Statistical Institute presents to users of statistical information the annual publication - Statistical Reference Book 2023 in English.
The Statistical Reference Book presents topical information on the demographic processes as well as the economic, social and cultural development of the Republic of Bulgaria for the 2018 - 2022 period.
The publication presents data on main macroeconomic indicators of the national economy - gross domestic product, investments and finance; and economic activity groupings - industry, agriculture, fore...
Key Indicators for Bulgaria (as of 03.07.2023)

Statistical Yearbook 2022
The National Statistical Institute (NSI) has the pleasure to present to the attention of national and foreign users of statistical information the 90th edition of the ‘Statistical Yearbook of the Republic of Bulgaria’ in printed format.
It provides current statistical information about the demographic, economic and social development of the country for 2016 - 2021 in different territorial and classification aggregations and breakdowns.
According to the Law on Statistics, official source of information in the Republic of Bulgaria is the National Statistical ...
Key Indicators for Bulgaria (as of 03.04.2023)

Key Indicators for Bulgaria (as of 30.12.2022)

Key Indicators for Bulgaria (as of 03.10.2022)

Statistical Reference Book 2022
The National Statistical Institute presents to users of statistical information the annual publication - Statistical Reference Book 2022 in English.
The Statistical Reference Book presents topical information on the demographic processes as well as the economic, social and cultural development of the Republic of Bulgaria for the 2017 - 2021 period.
The publication presents data on main macroeconomic indicators of the national economy - gross domestic product, investments and finance; and economic activity groupings - industry, agriculture, ...
Bulgaria 2022
The National Statistical Institute presents the bilingual (Bulgarian/English) brochure Bulgaria 2022 to users of statistical information. The brochure is addressed to a wide range of users (international institutions, business, students, experts etc.) and changes the traditional presentation of statistical information by offering an innovative structure with a parallel translation in English. The publication contains topical statistical information about the demographic, social and economic development of the country over the 2016 - 2021 period. It also includes n...
Statistical Reference Book 2022 (Bulgarian version)
The National Statistical Institute presents to users of statistical information the annual publication - Statistical Reference Book 2022 in Bulgarian.
The Statistical Reference Book presents topical information on the demographic processes as well as the economic, social and cultural development of the Republic of Bulgaria for the 2017 - 2021 period.
The publication presents data on main macroeconomic indicators of the national economy - gross domestic product, investments and finance; and economic activity groupings - industry, agriculture, fo...
Key Indicators for Bulgaria (as of 04.07.2022)

Statistical Yearbook 2021
The National Statistical Institute (NSI) has the pleasure to present to the attention of national and foreign users of statistical information the 89th edition of the ‘Statistical Yearbook of the Republic of Bulgaria’ in printed and electronic format.
It provides current statistical information about the demographic, economic and social development of the country for 2015 - 2020 in different territorial and classification aggregations and breakdowns.
According to the Law on Statistics, official source of information in the Republic of Bulgaria is the ...
Key Indicators for Bulgaria (as of 04.04.2022)

Key Indicators for Bulgaria (as of 31.12.2021)

Key Indicators for Bulgaria (as of 04.10.2021)

Statistical Reference Book 2021
The National Statistical Institute presents to users of statistical information the annual publication - Statistical Reference Book 2021 in English.
The Statistical Reference Book presents topical information on the demographic processes as well as the economic, social and cultural development of the Republic of Bulgaria for the 2016 - 2020 period.
The publication presents data on main macroeconomic indicators of the national economy - gross domestic product, investments and finance; and economic activity groupings - industry, agriculture, forestry, ...
Key Indicators for Bulgaria (as of 05.07.2021)

Statistical Reference Book 2021 (Bulgarian version)

The National Statistical Institute presents to users of statistical information the annual publication - Statistical Reference Book 2021 in Bulgarian.
The Statistical Reference Book presents topical information on the demographic processes as well as the economic, social and cultural development of the Republic of Bulgaria for the 2016 - 2020 period.
The publication presents data on main macroeconomic indicators of the national economy - gross domestic product, investments and finance; and economic activity groupings - industry, agri...
Statistical Yearbook 2020
The National Statistical Institute (NSI) has the pleasure to present to the attention of national and foreign users of statistical information the 88th edition of the ‘Statistical Yearbook of the Republic of Bulgaria’ in printed and electronic format.
It provides current statistical information about the demographic, economic and social development of the country for 2014 - 2019 in different territorial and classification aggregations and breakdowns.
According to the Law on Statistics, official source of information in the Republic of Bulgaria is the ...
Bulgaria 2021
The National Statistical Institute presents the bilingual (Bulgarian/English) brochure Bulgaria 2021 to users of statistical information. The brochure is addressed to a wide range of users (international institutions, business, students, experts etc.) and changes the traditional presentation of statistical information by offering an innovative structure with a parallel translation in English. The publication contains topical statistical information about the demographic, social and economic development of the country over the 2015 - 2020 period. It also includes non-traditional i...
Key Indicators for Bulgaria (as of 05.04.2021)

Statistical Yearbook 2012
The National Statistical Institute (NSI) has the pleasure to submit to the attention of national and foreign users of statistical information the 80th edition of the ‘Statistical Yearbook of the Republic of Bulgaria’ in printed and electronic format.
It provides current statistical information about the demographic, economic and social development of the country for the 2007 - 2011 period in different territorial and classification aggregations and breakdowns.
Accor...
Key Indicators for Bulgaria (as of 31.12.2020)

Key Indicators for Bulgaria (as of 05.10.2020)

Main Macroeconomic Indicators 2018
The National Statistical Institute informs users of statistical information that the annual bilingual (Bulgarian/English) publication Main Macroeconomic Indicators 2018 is already available. The issue contains the results from official statistics' work on calculation of main macroeconomic indicators for Bulgaria in accordance with the System of National Accounts (SNA 2008) and the European System of Accounts (ESA 2010).
The publication presents time series data for Bulgaria's gross domestic product (GDP) for the 2002 - 2018 period; main indicators characteriz...
Key Indicators for Bulgaria (as of 06.07.2020)

Statistical Reference Book 2020
The National Statistical Institute presents to users of statistical information the annual publication - Statistical Reference Book 2020 in English.
The Statistical Reference Book presents topical information on the demographic processes as well as the economic, social and cultural development of the Republic of Bulgaria for the 2016 - 2019 period.
The publication presents data on main macroeconomic indicators of the national economy - gross domestic product, investments and finance; and economic activity groupings - industry, agriculture, forestry, ...
Statistical Reference Book 2020 (Bulgarian version)
The National Statistical Institute presents to users of statistical information the annual publication - Statistical Reference Book 2020 in Bulgarian.
The Statistical Reference Book presents topical information on the demographic processes as well as the economic, social and cultural development of the Republic of Bulgaria for the 2016 - 2019 period.
The publication presents data on main macroeconomic indicators of the national economy - gross domestic product, investments and finance; and economic activity groupings - industry, agriculture,...
Bulgaria 2020
The National Statistical Institute presents the bilingual (Bulgarian/English) brochure Bulgaria 2020 to users of statistical information. The brochure is addressed to a wide range of users (international institutions, business, students, experts etc.) and changes the traditional presentation of statistical information by offering an innovative structure with a parallel translation in English. The publication contains topical statistical information about the demographic, social and economic development of the country over the 2014 - 2019 period. It also includes non-trad...
Statistical Yearbook 2019
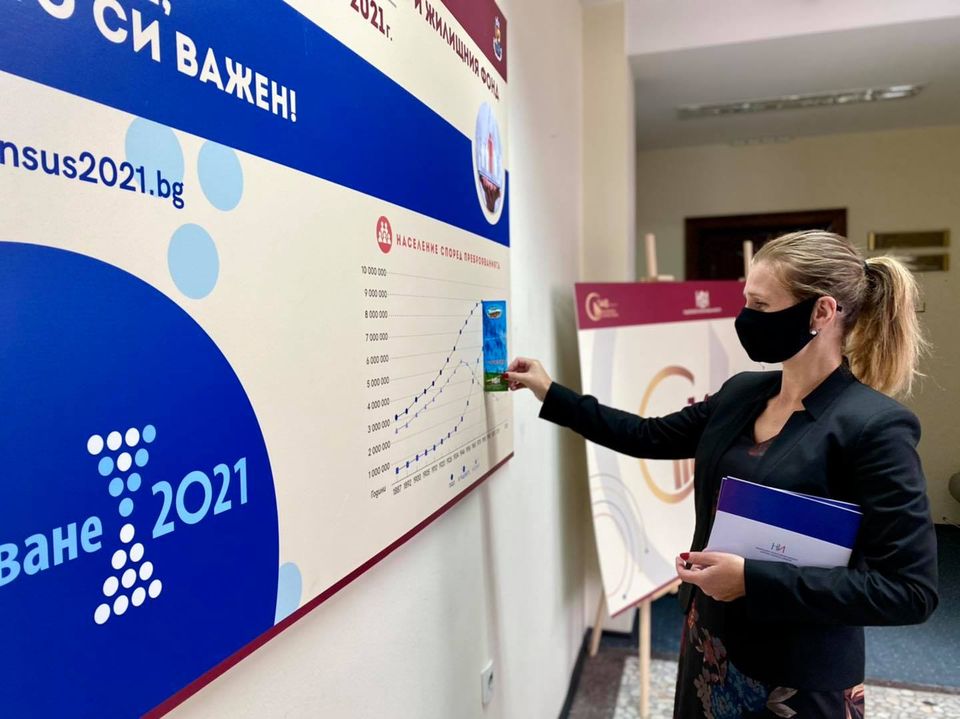
The National Statistical Institute (NSI) has the pleasure to present to the attention of national and foreign users of statistical information the 87th edition of the ‘Statistical Yearbook of the Republic of Bulgaria’ in printed and electronic format.
It provides current statistical information about the demographic, economic and social development of the country for 2013 - 2018 in different territorial and classification aggregations and breakdowns.
According to the Law on Statistics, official source of information in the Republic of Bulgaria is the ...
Key Indicators for Bulgaria (as of 06.04.2020)
Key Indicators for Bulgaria (as of 31.12.2019)
Key Indicators for Bulgaria (as of 04.10.2019)
Key Indicators for Bulgaria (as of 05.07.2019)
Statistical Yearbook 2018 in infographics
The National Statistical Institute presents to your attention the 86th edition of the Statistical Yearbook of the Republic of Bulgaria in infographics.
In 2018, for the first time, we presented the results of the statistical surveys through graphics, images and other visualization tools, which resulted in a positive response among a wide range of users. We believe that this modern way of presenting statistical information will trigger the interest in those who for the first time encounter the meaning of numbers revealing important aspects of socio-economic life.
...Statistical Reference Book 2019

The National Statistical Institute presents to users of statistical information the annual publication - Statistical Reference Book 2019 in English.
The Statistical Reference Book presents topical information on the demographic processes as well as the economic, social and cultural development of the Republic of Bulgaria for the 2015 - 2018 period.
The publication presents data on main macroeconomic indicators of the national economy - gross domestic product, investments and finance; and economic activity groupings - industry, agriculture, f...
Statistical Reference Book 2019 (Bulgarian version)

The National Statistical Institute presents to users of statistical information the annual publication - Statistical Reference Book 2019 in Bulgarian.
The Statistical Reference Book presents topical information on the demographic processes as well as the economic, social and cultural development of the Republic of Bulgaria for the 2015 - 2018 period.
The publication presents data on main macroeconomic indicators of the national economy - gross domestic product, investments and finance; and economic activity groupings - industry, agriculture, forestry, transp...
Statistical Yearbook 2018

The National Statistical Institute (NSI) has the pleasure to present to the attention of national and foreign users of statistical information the 86th edition of the ‘Statistical Yearbook of the Republic of Bulgaria’ in printed and electronic format.
It provides current statistical information about the demographic, economic and social development of the country for 2012 - 2017 in different territorial and classification aggregations and breakdowns.
According to the Law on Statistics, official source of information in the Republic of Bulgaria is the ...
Key Indicators for Bulgaria (as of 05.04.2019)
Main Macroeconomic Indicators 2017
The National Statistical Institute informs users of statistical information that the annual bilingual (Bulgarian/English) publication Main Macroeconomic Indicators 2017 is already available. The issue contains the results from official statistics' work on calculation of main macroeconomic indicators for Bulgaria in accordance with the System of National Accounts (SNA 2008) and the European System of Accounts (ESA 2010).
The publication presents time series data for Bulgaria's gross domestic product (GDP) for the 2001 - 2017 period; main indicators characterizing the e...
Key Indicators for Bulgaria (as of 28.12.2018)
Key Indicators for Bulgaria (as of 05.10.2018)
Key Indicators for Bulgaria (as of 06.07.2018)
Statistical Reference Book 2018
The National Statistical Institute presents to users of statistical information the annual publication - Statistical Reference Book 2018 in English.
The Statistical Reference Book presents topical information on the demographic processes as well as the economic, social and cultural development of the Republic of Bulgaria for the 2014 - 2017 period.
The publication presents data on main macroeconomic indicators of the national economy - gross domestic product, investments and finance; and economic activity groupings - industry, agriculture, f...
Statistical Yearbook 2017 in infographics
The National Statistical Institute of Bulgaria offers a different view of the statistical information included in the 85th edition of the Statistical Yearbook of the Republic of Bulgaria.
The publication is intended for a wider audience as statistical data are presented in a plain and easy understandable way.
The current state and changes in the socio-economic and cultural life in the country are presented not in the traditional way in tables and text, but through infographics - images, graphics and other visualization tools.
We belie...
Statistical Reference Book 2018 (Bulgarian version)
The National Statistical Institute presents to users of statistical information the annual publication - Statistical Reference Book 2018 in Bulgarian.
The Statistical Reference Book presents topical information on the demographic processes as well as the economic, social and cultural development of the Republic of Bulgaria for the 2014 - 2017 period.
The publication presents data on main macroeconomic indicators of the national economy - gross domestic product, investments and finance; and economic activity groupings - industry, agriculture, forestry, transp...
Statistical Yearbook 2017
The National Statistical Institute (NSI) has the pleasure to present to the attention of national and foreign users of statistical information the 84th edition of the ‘Statistical Yearbook of the Republic of Bulgaria’ in printed and electronic format.
It provides current statistical information about the demographic, economic and social development of the country for 2012 - 2016 in different territorial and classification aggregations and breakdowns.
According to the Law on Statistics, official source of information in the Republic of Bulgaria is the ...
Bulgaria 2018
The National Statistical Institute presents the bilingual (Bulgarian/English) brochure Bulgaria 2018 to users of statistical information. The brochure is addressed to a wide range of users (international institutions, business, students, experts etc.) and changes the traditional presentation of statistical information by offering an innovative structure with a parallel translation in English. The publication contains topical statistical information about the demographic, social and economic development of the country over the 2013 - 2017 period. It also includes non-trad...
Key Indicators for Bulgaria (as of 05.04.2018)
Main Macroeconomic Indicators 2016

The National Statistical Institute informs users of statistical information that the annual bilingual (Bulgarian/English) publication Main Macroeconomic Indicators 2016 is already available. The issue contains the results from official statistics' work on calculation of main macroeconomic indicators for Bulgaria in accordance with the System of National Accounts (SNA 2008) and the European System of Accounts (ESA 2010).
The publication presents time series data for Bulgaria's gross domestic product (GDP) for the 2001 - 2016 period; main indicators characterizing the e...
Key Indicators for Bulgaria (as of 29.12.2017)
Key Indicators for Bulgaria (as of 06.10.2017)
Key Indicators for Bulgaria (as of 06.07.2017)
Statistical Reference Book 2017
The National Statistical Institute presents to users of statistical information the annual publication - Statistical Reference Book 2017 in English.
The Statistical Reference Book presents topical information on the demographic processes as well as the economic, social and cultural development of the Republic of Bulgaria for the 2013 - 2016 period.
The publication presents data on main macroeconomic indicators of the national economy - gross domestic product, investments and finance; and economic activity groupings - industry, agriculture, f...
Statistical Reference Book 2017 (Bulgarian version)
The National Statistical Institute presents to users of statistical information the annual publication - Statistical Reference Book 2017 in Bulgarian.
The Statistical Reference Book presents topical information on the demographic processes as well as the economic, social and cultural development of the Republic of Bulgaria for the 2013 - 2016 period.
The publication presents data on main macroeconomic indicators of the national economy - gross domestic product, investments and finance; and economic activity groupings - industry, agriculture, forestry, transp...
Bulgaria 2017
The National Statistical Institute presents the bilingual (Bulgarian/English) brochure Bulgaria 2017 to users of statistical information. The brochure is addressed to a wide range of users (international institutions, business, students, experts etc.) and changes the traditional presentation of statistical information by offering an innovative structure with a parallel translation in English. The publication contains topical statistical information about the demographic, social and economic development of the country over the 2012 - 2016 period. It also includes non-traditional i...
Statistical Yearbook 2016
The National Statistical Institute (NSI) has the pleasure to present to the attention of national and foreign users of statistical information the 84th edition of the ‘Statistical Yearbook of the Republic of Bulgaria’ in printed and electronic format.
It provides current statistical information about the demographic, economic and social development of the country for 2011 - 2015 in different territorial and classification aggregations and breakdowns.
According to the Law on Statistics, official source of information in the Republic of Bulgaria is the ...
Main Macroeconomic Indicators 2015

The National Statistical Institute informs users of statistical information that the annual bilingual (Bulgarian/English) publication Main Macroeconomic Indicators 2015 is already available. The issue contains the results from official statistics' work on calculation of main macroeconomic indicators for Bulgaria in accordance with the System of National Accounts (SNA 2008) and the European System of Accounts (ESA 2010).
The publication presents time series data for Bulgaria's gross domestic product (GDP) for the 2000 - 2015 period; main indicators characterizing the e...
Key Indicators for Bulgaria (as of 06.04.2017)
Key Indicators for Bulgaria (as of 30.12.2016)
Key Indicators for Bulgaria (as of 06.10.2016)
Key Indicators for Bulgaria (as of 06.07.2016)
Statistical Reference Book 2016

The National Statistical Institute presents to users of statistical information the annual publication - Statistical Reference Book 2016 in English.
The Statistical Reference Book presents topical information on the demographic processes as well as the economic, social and cultural development of the Republic of Bulgaria for the 2012 - 2015 period.
The publication presents data on main macroeconomic indicators of the national economy - gross domestic product, investments and finance; and economic activity groupings - industry, agriculture, forestry, transpor...
Statistical Reference Book 2016 (Bulgarian version)

The National Statistical Institute presents to users of statistical information the annual publication - Statistical Reference Book 2016 in Bulgarian.
The Statistical Reference Book presents topical information on the demographic processes as well as the economic, social and cultural development of the Republic of Bulgaria for the 2012 - 2015 period.
The publication presents data on main macroeconomic indicators of the national economy - gross domestic product, investments and finance; and economic activity groupings - industry, agriculture, forestry, transp...
Bulgaria 2016
The National Statistical Institute presents the bilingual (Bulgarian/English) brochure Bulgaria 2016 to users of statistical information. The brochure is addressed to a wide range of users (international institutions, businessmen, students, experts etc.) and changes the traditional presentation of statistical information by offering an innovative structure with a parallel translation in English. The publication contains topical statistical information about the demographic, social and economic development of the country over the 2011 - 2015 period. It also includes non-traditiona...
Statistical Yearbook 2015
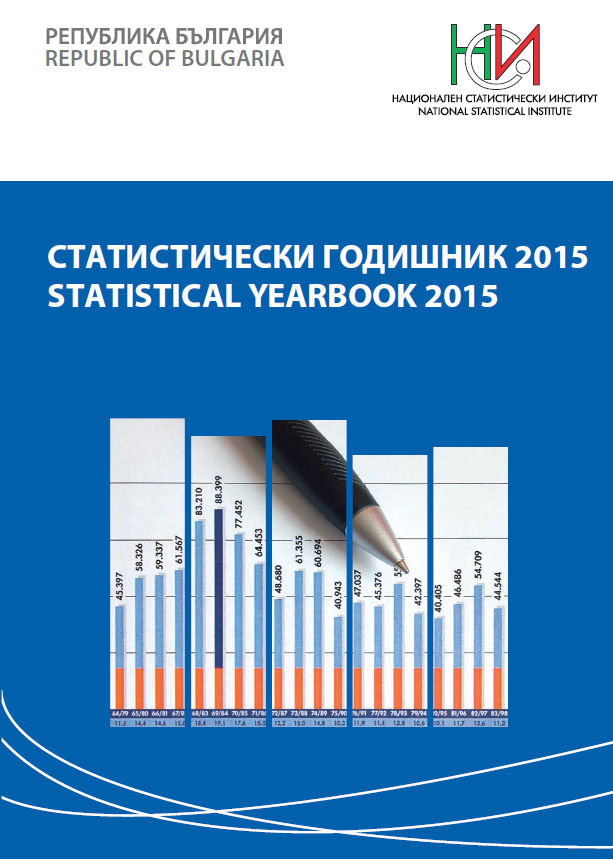
The National Statistical Institute (NSI) has the pleasure to present to the attention of national and foreign users of statistical information the 83rd edition of the ‘Statistical Yearbook of the Republic of Bulgaria’ in printed and electronic format.
It provides current statistical information about the demographic, economic and social development of the country for 2010 - 2014 in different territorial and classification aggregations and breakdowns.
According to the Law on Statistics, official source of information in the Republic of Bulgaria is the ...
Key Indicators for Bulgaria (as of 06.04.2016)
Main Macroeconomic Indicators 2014

The National Statistical Institute informs users of statistical information that the annual bilingual (Bulgarian/English) publication Main Macroeconomic Indicators 2014 is already available. The issue contains the results from official statistics' work on calculation of main macroeconomic indicators for Bulgaria in accordance with the System of National Accounts (SNA 2008) and the European System of Accounts (ESA 2010).
The publication presents time series data for Bulgaria's gross domestic product (GDP) for the 1999 - 2014 period; main indicators characterizing ...
Key Indicators for Bulgaria (as of 30.12.2015)
Key Indicators for Bulgaria (as of 05.10.2015)
Key Indicators for Bulgaria (as of 02.07.2015)
Statistical Reference Book 2015
The National Statistical Institute presents to users of statistical information the annual publication - Statistical Reference Book 2015 in English.
The Statistical Reference Book presents topical information on the demographic processes as well as the economic, social and cultural development of the Republic of Bulgaria for the 2010 - 2014 period.
The publication presents data on main macroeconomic indicators of the national economy - gross domestic product, investments and finance; and economic activity groupings - industry, agriculture, forestry, transport, c...
Statistical Reference Book 2015 (Bulgarian version)
The National Statistical Institute presents to users of statistical information the annual publication - Statistical Reference Book 2015 in Bulgarian.
The Statistical Reference Book presents topical information on the demographic processes as well as the economic, social and cultural development of the Republic of Bulgaria for the 2010 - 2014 period.
The publication presents data on main macroeconomic indicators of the national economy - gross domestic product, investments and finance; and economic activity groupings - industry, agriculture, forestry, transport,...
Bulgaria 2015
The National Statistical Institute presents the bilingual (Bulgarian/English) brochure Bulgaria 2015 to users of statistical information. The brochure is addressed to a wide range of users (international institutions, businessmen, students, experts etc.) and changes the traditional presentation of statistical information by offering an innovative structure with a parallel translation in English. The publication contains topical statistical information about the demographic, social and economic development of the country over the 2010 - 2014 period. It also includes non-tra...
Statistical Yearbook 2014
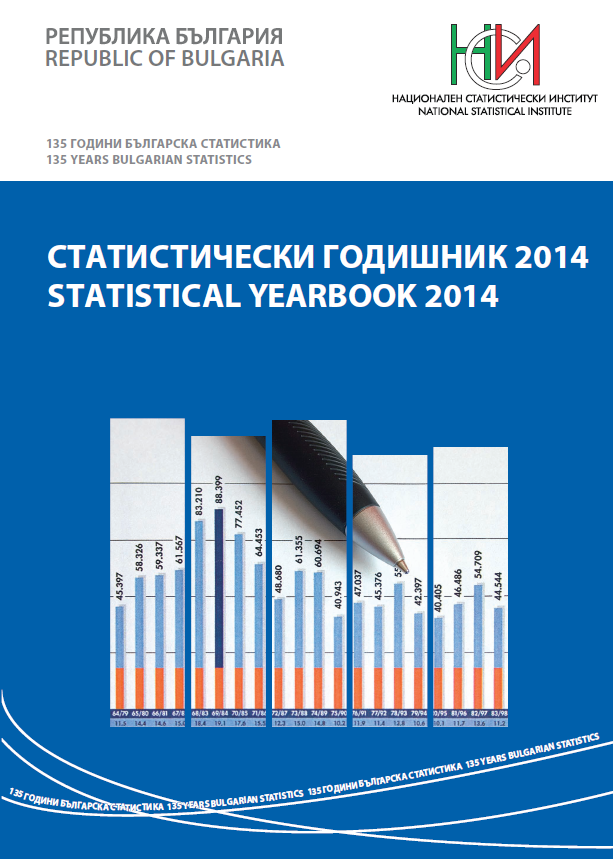
The National Statistical Institute (NSI) has the pleasure to present to the attention of national and foreign users of statistical information the 82nd edition of the ‘Statistical Yearbook of the Republic of Bulgaria’ in printed and electronic format.
It provides current statistical information about the demographic, economic and social development of the country for 2009 - 2013 in different territorial and classification aggregations and breakdowns.
According to the Law on Statistics, official source of information in the Republic of Bulgaria is the Nati...
Key Indicators for Bulgaria (as of 02.04.2015)
Key Indicators for Bulgaria (as of 30.12.2014)
Key Indicators for Bulgaria (as of 01.10.2014)
Key Indicators for Bulgaria (as of 02.07.2014)
Statistical Reference Book 2014

The National Statistical Institute presents to users of statistical information the annual publication - Statistical Reference Book 2014 in English.
The Statistical Reference Book presents topical information on the demographic processes as well as the economic, social and cultural development of the Republic of Bulgaria for the 2009 - 2013 period.
The publication presents data on main macroeconomic indicators of the national economy - gross domestic product, investments and finance; and economic activity groupings - industry, agriculture, forestry, tran...
Statistical Reference Book 2014 (Bulgarian version)

The National Statistical Institute presents to users of statistical information the annual publication - Statistical Reference Book 2014 in Bulgarian.
The Statistical Reference Book presents topical information on the demographic processes as well as the economic, social and cultural development of the Republic of Bulgaria for the 2009 - 2013 period.
The publication presents data on main macroeconomic indicators of the national economy - gross domestic product, investments and finance; and economic activity groupings - industry, agriculture, forestry, tr...
Bulgaria 2014

The National Statistical Institute presents the bilingual (Bulgarian/English) brochure Bulgaria 2014 to users of statistical information. The brochure is addressed to a wide range of users (international institutions, businessmen, students, experts etc.) and changes the traditional presentation of statistical information by offering an innovative structure with a parallel translation in English. The publication contains topical statistical information about the demographic, social and economic development of the country over the 2008 - 2013 period. It also includes non-traditional ...
Statistical Yearbook 2013

The National Statistical Institute (NSI) has the pleasure to present to the attention of national and foreign users of statistical information the 81st edition of the ‘Statistical Yearbook of the Republic of Bulgaria’ in printed and electronic format.
It provides current statistical information about the demographic, economic and social development of the country for 2008 - 2012 in different territorial and classification aggregations and breakdowns.
According to the Law on Statistics, official source of information in the Republic of Bulgaria is the Nati...
Key Indicators for Bulgaria (as of 02.04.2014)
Key Indicators for Bulgaria (as of 30.12.2013)
Key Indicators for Bulgaria (as of 01.10.2013)
Main Macroeconomic Indicators 2011
The National Statistical Institute informs users of statistical information that the annual bilingual (Bulgarian/English) publication Main Macroeconomic Indicators 2011 is already available. The issue contains the results from official statistics' work on calculation of main macroeconomic indicators for Bulgaria in accordance with the System of National Accounts (SNA '93) and the European System of Accounts (ESA '95). The publication presents time series data for Bulgaria's gross domestic product (GDP) for the 1995 - 2011 period; main indicators characterizing...
Statistical Reference Book 2013
The National Statistical Institute presents to users of statistical information the annual publication - Statistical Reference Book 2013 in English.
The Statistical Reference Book presents topical information on the demographic processes as well as the economic, social and cultural development of the Republic of Bulgaria for the 2008 - 2012 period.
The publication presents data on main macroeconomic indicators of the national economy - gross domestic product, investments and finance; and economic activity groupings - industry, agric...
Key Indicators for Bulgaria (as of 02.07.2013)
Statistical Reference Book 2013 (Bulgarian version)

The National Statistical Institute presents to users of statistical information the annual publication - Statistical Reference Book 2013 in Bulgarian.
The Statistical Reference Book presents topical information on the demographic processes as well as the economic, social and cultural development of the Republic of Bulgaria for the 2008 - 2012 period.
The publication presents data on main macroeconomic indicators of the national economy - gross domestic product, investments and finance; and economic activity groupings - industry, agr...
Bulgaria 2013

The National Statistical Institute presents the bilingual (Bulgarian/English) brochure Bulgaria 2013 to users of statistical information. The brochure is addressed to a wide range of users (international institutions, businessmen, students, experts etc.) and changes the traditional presentation of statistical information by offering an innovative structure with a parallel translation in English. The publication contains topical statistical information about the demographic, social and economic development of the country over the 2007 - 2012 period. It also inc...
Key Indicators for Bulgaria (as of 02.04.2013)
Key Indicators for Bulgaria (as of 28.12.2012)
Main Macroeconomic Indicators 2010
The National Statistical Institute informs users of statistical information that the annual bilingual (Bulgarian/English) publication Main Macroeconomic Indicators 2010 is already available. The issue contains the results from official statistics' work on calculation of main macroeconomic indicators for Bulgaria in accordance with the System of National Accounts (SNA '93) and the European System of Accounts (ESA '95). The publication presents time series data for Bulgaria's gross domestic product (GDP) for the 1995 - 2010 period; main indicators characterizing...
Key Indicators for Bulgaria (as of 01.10.2012)
Statistical Reference Book 2012

The National Statistical Institute presents to users of statistical information the annual publication - Statistical Reference Book 2012 in English.
The Statistical Reference Book represents topical information on the demographic processes as well as the economic, social and cultural development of the Republic of Bulgaria for the 2007 - 2011 period.
The publication presents data on main macroeconomic indicators of the national economy - gross domestic product, investments and finance; and economic activity groupings - industry, agr...
Statistical Reference Book 2012 (Bulgarian version)

The National Statistical Institute presents to users of statistical information the annual publication - Statistical Reference Book 2012 in Bulgarian.
The Statistical Reference Book presents topical information on the demographic processes as well as the economic, social and cultural development of the Republic of Bulgaria for the 2007 - 2011 period.
The publication presents data on main macroeconomic indicators of the national economy - gross domestic product, investments and finance; and economic activity groupings&...
Key Indicators for Bulgaria (as of 02.07.2012)
Bulgaria 2012
The National Statistical Institute presents the bilingual (Bulgarian/English) brochure Bulgaria 2012 to users of statistical information. The brochure is addressed to a wide range of users (international institutions, businessmen, students, experts etc.) and changes the traditional presentation of statistical information by offering an innovative structure with a parallel translation in English. The publication contains topical statistical information about the demographic, social and economic development of the country over the 2006 - 2011 period. It also inc...
Statistical Yearbook 2011
The National Statistical Institute (NSI) has the pleasure to submit to the attention of national and foreign users of statistical information the 79th edition of the ‘Statistical Yearbook of the Republic of Bulgaria’ in printed and electronic format.
It provides current statistical information about the demographic, economic and social development of the country for the 2005 - 2010 period in different territorial and classification aggregations and breakdowns.
According ...
Key Indicators for Bulgaria (as of 02.04.2012)
Key Indicators for Bulgaria (as of 30.12.2011)
Key Indicators for Bulgaria (as of 30.09.2011)
Statistical Reference Book 2011
The National Statistical Institute presents to users of statistical information the annual publication - Statistical Reference Book 2011 in English. It is a concise form of the same issue in Bulgarian.
The Statistical Reference Book presents topical information on the demographic processes as well as the economic, social and cultural development of the Republic of Bulgaria for the 2006 - 2010 period.
The publication presents data on main macroeconomic indicators of the national economy - gross domestic product, investments...
Bulgaria 2011

The National Statistical Institute presents the bilingual (Bulgarian/English) brochure Bulgaria 2011 to users of statistical information. The brochure is addressed to a wide range of users (international institutions, businessmen, students, experts etc.) and changes the traditional presentation of statistical information by offering an innovative structure with a parallel translation in English. The publication contains topical statistical information about the demographic, social and economic development of the country over the 2005 - 2010 period. It als...
Key Indicators for Bulgaria (as of 01.07.2011)
Statistical Yearbook 2010
The National Statistical Institute (NSI) has the pleasure to submit to the attention of national and foreign users of statistical information the 78th edition of the ‘Statistical Yearbook of the Republic of Bulgaria’ in printed and electronic format.
It provides current statistical information about the demographic, economic and social development of the country for the 2004 - 2009 period in different territorial and classification aggregations and breakdowns.
Accor...
Key Indicators for Bulgaria (as of 01.04.2011)
Statistical Yearbook 2009
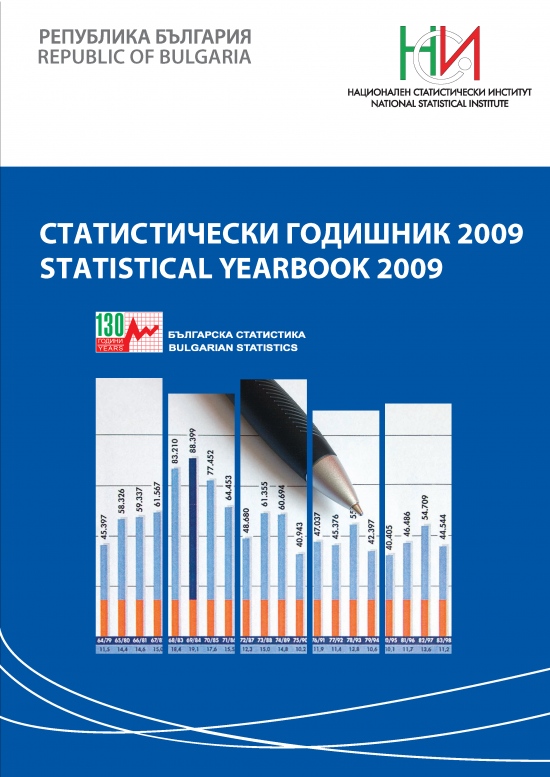
The National Statistical Institute (NSI) has the pleasure to submit to the attention of national and foreign users of statistical information the 77th edition of the ‘Statistical Yearbook of the Republic of Bulgaria’ in printed and electronic format. The issue is published in 2010, which marks 130 years since the establishment of a statistical institution in Bulgaria and 100 years since publishing of the first ‘Statistical Yearbook of the Bulgarian Kingdom’ in 1910.
This issue has new design and layout. It provides current statistical information about ...
Key Indicators for Bulgaria (as of 30.12.2010)
Statistical Reference Book 2010

The National Statistical Institute presents to users of statistical information the annual publication - Statistical Reference Book 2010 in English. It is a concise form of the same issue in Bulgarian.
The Statistical Reference Book presents topical information on the demographic processes as well as the economic, social and cultural development of the Republic of Bulgaria for the 2005 - 2009 period.
The publication presents data on main macroeconomic indicators of the national economy - gross domestic product, investments...
Key Indicators for Bulgaria (as of 30.09.2010)
Bulgaria 2010
The National Statistical Institute presents the bilingual (Bulgarian/English) brochure Bulgaria 2010 to users of statistical information. The brochure is addressed to a wide range of users (international institutions, businessmen, students, experts etc.) and changes the traditional presentation of statistical information by offering an innovative structure with a parallel translation in English. The publication contains topical statistical information about the demographic, social and economic development of the country over the 2003 - 2009 period. It also inc...
Bulgaria 2009 - Statistical Panorama
The National Statistical Institute annual publication Bulgaria 2009 - Statistical Panorama (in Bulgarian and summary in English) is available to users of statistical information. In the issue are analyzed the demographic, social and economic development of the Republic of Bulgaria in 2009. Comparisons with the previuous 2008, the basic 2000 and the year 1995 are also made. The publication considers trends and structural changes occurring in the country. Results from pilot Eurostat projects and one-time surveys in the respective fields are being used.
<...Key Indicators for Bulgaria (as of 30.06.2010)
Key Indicators for Bulgaria (as of 02.04.2010)
Key Indicators for Bulgaria (as of 30.12.2009)
Statistical Reference Book 2009
The National Statistical Institute presents to users of statistical information the annual publication - Statistical Reference Book 2009 in English. It is a concise form of the same issue in Bulgarian.
The issue is with a new design and enrich contents. For the first time are included methodological and analytic notes towards all chapters. The information is illustrated with a rich graphic materials.
The Statistical Reference Book presents topical information on the demographic processes as well as the economic, social and cultural ...
Main macroeconomic indicators 2008
The National Statistical Institute of Bulgaria presents to the users of statistical information the annual bilingual (Bulgarian-English) publication Main Macroeconomic Indicators 2008. The issue contains the results from official statistics' work on calculation of main macroeconomic indicators for Bulgaria in accordance with the System of National Accounts (SNA '93) and the European System of Accounts (ESA '95). The publication presents time series data for Bulgaria's gross domestic product (GDP) for the 1980 - 2008 period; main indicators characterizing ...
Key Indicators for Bulgaria (as of 30.09.2009)
Supply - Use Tables 2004
The National Statistical Institute informs the users of statistical information that the new electronic publication ‘Supply and Use Tables’ is already on sale.
The publication contains Supply and Use tables for year 2004, prepared by NSI. As the Tables are an integrated part of Annual National Accounts, they present in a final and balanced version the economical categories into the GDP, structured in details by groups of products and services, types of production activities and types of categories of final demand.
The general conceptual frame...
Bulgaria 2008 - Statistical Panorama
The National Statistical Institute annual publication Bulgaria 2008 - Statistical Panorama (in Bulgarian and summary in English) is available to users of statistical information. In the issue are analyzed the demographic, social and economic development of the Republic of Bulgaria in 2008. Comparisons with the preceding years are made and the tendencies of the development and the current structural changes are considered.
The publication is formed topically by sections, as each section contains short analytical text with charts and tables. The mai...
Bulgaria 2009
The National Statistical Institute presents the bilingual (Bulgarian/English) brochure Bulgaria 2009 to users of statistical information. The brochure is addressed to a wide range of users (international institutions, businessmen, students, experts etc.) and changes the traditional presentation of statistical information by offering an innovative structure with a parallel translation in English. The publication contains topical statistical information about the demographic, social and economic development of the country over the 2003 - 2008 period. It also inc...
Statistical Yearbook 2008
The National Statistical Institute has the pleasure to submit to the attention of national and foreign users of statistical information the 76th edition of the Statistical Yearbook of the Republic of Bulgaria 2008. It provides topical statistical information on the demographic, economic and social development of the country for the 2002 - 2007 period in different territorial and classification aggregations and breakdowns.
According to the Law on Statistics, official source of information in the Republic of Bulgaria is the National Statistical System, wh...
Main macroeconomic indicators 2007
The National Statistical Institute of Bulgaria presents to the users of statistical information the annual publication Main Macroeconomic Indicators 2007. The issue contains the results from official statistics' work on calculation of main macroeconomic indicators for Bulgaria in accordance with the System of National Accounts (SNA '93) and the European System of Accounts (ESA '95). The publication presents time series data for Bulgaria's gross domestic product (GDP) for the 1980 - 2007 period; main indicators characterizing the economy's development sinc...
Consumer price index and inflation
The National Statistical Institute presents to the users of statistical information new updated edition of the brochure Consumer Price Index and Inflation - Answers to the Most Frequently Asked Questions.
The consumer price index (CPI), which has been calculated since May 1990 in the Republic of Bulgaria, is one the most important economic indicators in the country. It has increasingly been used in the economic and social sphere by a broad range of users - the Government, business circles, local authorities and ordinary people. Because of the great i...
Statistical Reference Book of the Republic of Bulgaria 2008
The National Statistical Institute presents to users of statistical information one of its main publications - Statistical Reference Book of the Republic of Bulgaria 2008 in English. It is a concise form of the same issue in Bulgarian.
The Statistical Reference Book presents topical information on the demographic processes as well as the economic, social and cultural development of the Republic of Bulgaria for the 2004 - 2007 period.
The publication presents data on main macroeconomic indicators of the national economy - gross dom...


